
Over the last few years at zenml, we have regularly dealt with datasets that contain millions of data points. Today, I want to write about how the we use our machine learning platform, ZenML, to build production-ready distributed training pipelines. These pipelines are capable of dealing with millions of datapoints in a matter of hours. If you also want to build large-scale deep learning pipelines, sign up for ZenML for free here and follow along.
Datasource
A good way to get a hold of a dataset of the size we want is public Google BigQuery tables.
The one I chose for today's example is the New York Citi Bike dataset, which contains 33 million data points, holding information about various bike sharing trips in New York City. Here is a snippet of what the datasource looks like (*only relevant columns shown):
   birth_year | gender   |   end_station_id |   start_station_id |   tripduration | usertype
--------------+----------+------------------+--------------------+----------------+------------
         1977 | Female   |              103 |                100 |           1012 | Subscriber
         1991 | Male     |             1089 |                 23 |            530 | Customer
... etc. etc. 33 million more times
Our mission (if we choose to accept it) is to see if we can infer the birth_year of the person,
given all the rest of the data in this table.
Sound interesting? Alright, let's begin.
Building the Pipeline
When dealing with a dataset this large, its difficult to do some Pandas magic in a Jupyter notebook to wrangle with our data - I won't subject my poor ThinkPad to that punishment. Thats why we created ZenML to deal with this problem (amongst others).
For this post, I will assume you have the cengine CLI installed and ready to go.
As a summary, the cengine CLI will create, register and execute training pipelines,
which will be managed by us on our cloud platform. One can create the pipeline declaratively by
specifying a YAML configuration file.
For this example, I created a simple feedforward neural network pipeline. Here's how I did it:
Step 0: Add the datasource
First thing to do is create a data source. As the BigQuery table is public, it can be added by running:
cengine datasource create bq --name citibike_trips \
  --project "bigquery-public-data" \
  --dataset new_york \
  --table citibike_trips \
  --table_type public
After that you can run
cengine datasource list
And see the following details:
 Selection   |   ID | Name               |     Rows |   Cols |   Size (MB)
-------------+------+--------------------+----------+--------+-------------
 *           |   16 | citibike_trips     | 33319019 |     15 |        4689
The data contains 33,319,019 rows with 15 columns.
Step 1: Configure YAML - Features
Now we can build our YAML config. Usually I would use an easy-to-follow
configure command to create this, but for this post its easier to go section by section and build it manually. So open up a text editor
(I'm a Sublime Text guy but do it in VIM if you wish, whatever floats your boat):
features:
  end_station_id: {}
  gender: {}
  start_station_id: {}
  tripduration: {}
  usertype: {}
This will define the features we want to use for our pipeline. I dropped some features that I thought were redundant or could bias the model (like Bike ID). I mean, the model should have a challenge, right?
Also note that I didn't to any fancy embedding of start and end stations.
As Andrew Ng says: "Don’t start off trying to design and build the perfect system. Instead, build
and train a basic system quickly". So lets get to a baseline first.
Step 2: Configure YAML - Label
Ok next part is the label. Thats also easy:
labels:
  birth_year:
    loss: mse
    metrics: [mae]
So we define birth_year as the label, and say we want a mse (mean_squared_error) loss on the model. The metric I'll be tracking are mae (mean absolute error).
Step 3: Configure YAML - Split
So we need to split our data for this to make any sense. ZenML let's you split up the data in a variety of ways into train and eval (more splits support on its way!). Lets write:
split:
  categorize_by: start_station_name
  index_ratio: { train: 0.9, eval: 0.1 }
Three lines of YAML, but they pack a punch. ZenML will let you categorize your data before splitting it.
For our case, we want all start stations to be equally represented to avoid any biases. So we grouped by the start_station_name and divided each possible group in a 90-10 split. For you SQL folk, this is similar to doing a GROUP BY and then taking a partition over an index. This way our training and test data will have data with all the stations.
I feel like splitting up data is a very under-appreciated part of machine learning and plays an important part in ML fairness, so I tried to make an appropriate split here.
Step 4: Configure YAML - Trainer (Model definition)
We have arrived at, undoubtedly, the most interesting part of our YAML. The trainer, i.e., the actual model definition.
trainer:
  layers:
    - { type: dense, units: 64 } # a dense layer 64 units
    - { type: dense, units: 32 } # a dense layer with 32 units
  architecture: feedforward # can be feedforward or sequential
  last_activation: linear # last layer: we can take relu, but linear should also be fine
  num_output_units: 1 # How many units in the last layer? We choose 1 because we want to regress one number (i.e. date_of_birth)
  optimizer: adam # optimizer for loss function
  save_checkpoints_steps: 15000 # how many steps before we do a checkpoint evaluation for our Tensorboard logs
  eval_batch_size: 256 # batch size for evalulation that happens at every checkpoint
  train_batch_size: 256 # batch size for training
  train_steps: 230000 # two epochs
  type: regression # choose from [regression, classification, autoencoder]
It's quite straightforward really - we define 2 dense layers, set the optimizer and a few more nuts and bolts. The whole trainer follows quite closely the Keras API, so it would be quite straightforward for most people. The interesting bit about this trainer is the train_steps and batch_size. One step is one whole batch passing through the network, so with a 33 million datapoint dataset, 230,000 steps of 256 would be roughly 2 epochs of the data. Trust me, I did the math.
At this point you might be wondering what are the types of models you can create with this trainer key - so go ahead and read the developer docs for it. This part we're really trying to nail down and support for different sorts of models are always a priority.
Step 5: Configure YAML - Evaluation (Splitting Metrics)
Almost there! One last thing we might want to do is to add some evaluator slices. What does that mean? Well it means that we might may not just want to look at the overall metrics (i.e. overall mae) of the model, but the mae across a categorical column.
evaluator:
  birth_year: {} # I'd like to see how I did across each year
  gender: {} # I'd like to see if the model biases because of gender
  start_station_name: {} # I'd like to see how I did across each station
I defined three such columns which I was interested in seeing sliced metrics across. You'll see how this plays into the evaluation part of our pipeline in a bit.
The full config YAML
There are some things that I have intentionally skipped in the config for the sake of brevity. For reference, you can find the pipeline configuration ready to download here. I tried to annotate it with comments for clearer explanation. For further clarity, there is also always the docs to refer to. Most notably, the default key is perhaps important to look at as it defines the pre-processing steps that we took to normalize the data.
Run the pipeline
Ok now I can register a pipeline called nyc_citibike_experiment like so:
cengine pipeline push my_config.yaml nyc_citibike_experiment
ZenML will check your active datasource, and give an ops configuration that it deems suitable for the size of the job you're about to run. For this experiments, ZenML registered the pipeline with 4 workers at 96 cpus_per_worker. You can always change this if you want, but I decided to go for this configuration and ran the pipeline:
cengine pipeline run <pipeline_id>
Enter Y for the safety prompt that appears, and let it run!
You should see a success message with your chosen configuration. The platform will provision these resources in the cloud, connect automatically to the datasource, and create a machine learning pipeline to train the model. All preprocessing steps of the pipeline will be distributed across the workers and cpus. The training will happen on a Tesla K80 (distributed training coming soon!).
So now, you can sit back and relax. You don't need to watch dying Jupyter kernels or stare at as the steps go by on your terminal. Just grab a coffee, browse reddit, and chill.
Evaluate the results
While running, the status of a pipeline can be checked with:
cengine pipeline status --pipeline_id <pipeline_id>
Sample output:
   ID | Name                              | Pipeline Status   | Completion   |   Compute Cost (€) |   Training Cost (€) |   Total Cost (€) | Execution Time
-----------+-----------------------------------+-------------------+--------------+--------------------+---------------------+------------------+------------------
   1  | nyc_citibike_experiment           | Running           | 13%          |                  0 |                   0 |                0 | 0:14:21.187081
Once the pipeline hits the 100% completion mark, I can see the compute (preprocessing + evaluation) cost and training cost it incurred. For me, this pipeline took 74 minutes.
Preprocessing and training 33 million datapoints in just over an hour. Not too bad.
At that point, I can also evaluate it:
cengine pipeline evaluate <pipeline_id>
This opens up a pre-configured Jupyter notebook where I can view Tensorboard logs, along with the excellent Tensorflow Model Analysis (TFMA) plugin. Both of these will show me different things about the pipeline.
Tensorboard will show tensorboard things: The model graph, the train and eval loss etc. Here's how mine looks like:

That is pretty cool - Maybe we overtrained it at the 180,000th step as it took a jump in the loss, but the mae seems to keep decreasing. We're close to 9.6 mae overall, which isn't bad at all for this baseline model.
How about a deeper dive into the metrics? Thats where TFMA comes into play.
TFMA will show the metrics defined in the YAML and add the ability to slice the metric across the columns defined in the evaluator key. E.g. Lets slice it across birth_year to see how well it did for each year.
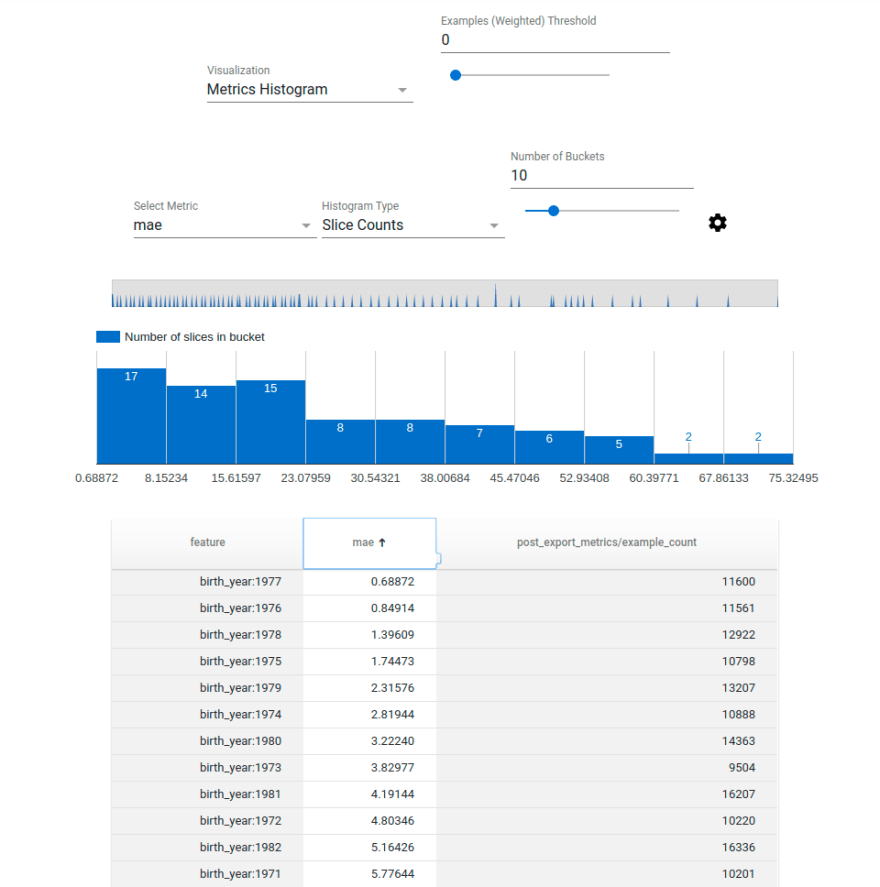
Note: If you want to replicate this step just add birth_year in the generated notebook code where its specified.
A deeper dive reveals that the model actually guessed the year of people born in 1977 pretty well (Thats tested on ~11000 samples from that year). So its definitely learning something. We can now dive which years it did worse, and also other slices and see if we can gain anything from that when we iterate on our model.
Wrap up
Now that we have the baseline model, its very simple to iterate on different sorts of models very quickly. The cool thing is that ZenML has stored all intermediate states of the pipeline (i.e. the preprocessed data) in an efficient and compressed binary format. Subsequent pipeline runs will warmstart the pipeline straight to the training part, given that everything else stays the same. This caching mechanism is actually quite powerful at this stage and can save up to 80% on time and cost. But I would leave that for a seperate post, where we can take the same pipeline and iterate on quickly to arrive at a more accurate model! So stay tuned for that.
If you liked this post, please make sure to follow us on Twitter, LinkedIn or just chat with us on our Discord server.
We're actively looking for beta testers to test the platform and we have a whole bunch of features coming up, including distributed training, automatic model serving, hyper-parameter tuning and image support.
Please visit the docs for details about
the platform, and if interested contact us directly!
In the meantime, stay safe and hope to see you all soon!

Top comments (0)