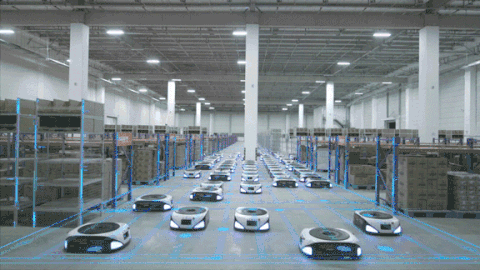
The increasing use of autonomous systems in industry is making systems more complex. Autonomous transportation vehicles, which have many uses, are one of them. Especially in places with limited space such as smart factories, a lot of control should be considered to prevent possible accidents that may arise from traffic. Therefore, comprehensive solutions are needed to keep the system up for as long as possible.
You can access all project on my github repo.
Let’s start ..
First of all, I would like to clarify that this approach was developed for the “Development of Autonomous Transportation Vehicles and HMI-M2M Interfaces for Smart Factories” project financed by TÜBİTAK.
There may be traffic caused by autonomous transportation vehicles (ATVs) in smart factories. Therefore, in order to ensure the sustainability of the system and increase its efficiency, it is necessary to analyze the data produced by the ATV and generate useful feedback fed into the system. For this purpose, five analyzes were taken into account as given below:
Travel time: The elapsed time between the ATV starting to task and finishing.
Waiting time: The elapsed time while ATV is waiting during performing its task.
Average speed: The average speed of the ATV while performing its task.
Occupancy: (way lenght) / (number of vehicle * vehicle length)
Density: ( number of vehicle / way length )
A document instance stored in MongoDB is shown below:
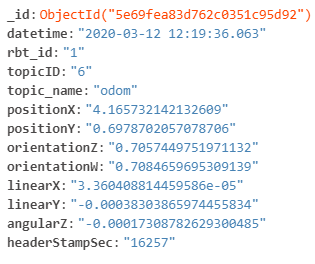
All system components communicate via ROS (Robot Operating System) which is a middleware. The data generated by the ATV’s sensors is instantly sent to MongoDB. Apache Spark analyzes this data, generates results every 15 minutes and writes the results to MsSQL.
The system architecture is given below:

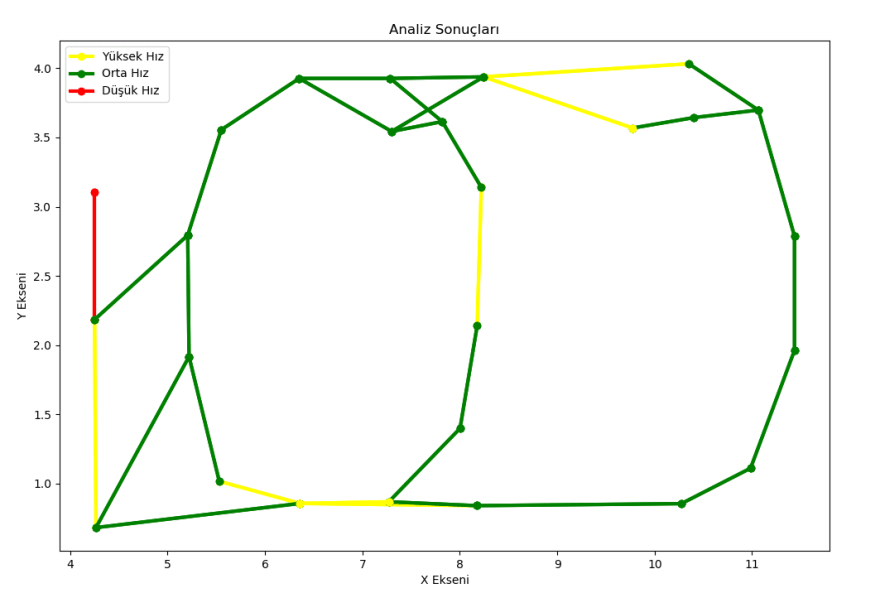
With the developed desktop application, it is also possible to visualize the results via the GUI. The application takes all analysis results from MSSQL and then visualizes it. It is able to display all five analysis result by grouping way ID or timestamp (every 15 minutes). You can see the min, max and average results and graphical representation of the selected analysis type as given below.
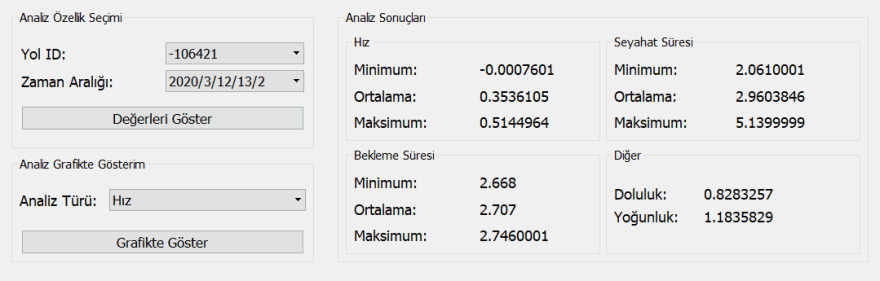
The ATV moves according to the given waypoints and completes the whole path. Analyzes are produced separately for each way. A way denotes the area between two waypoints.


Top comments (1)
Amazing 👏🏽