Incident management is one of the core practices of Site Reliability Engineering. As part of that, the SRE Book recommends focusing on prioritization during the incident itself. Specifically:
Prioritize. Stop the bleeding, restore service, and preserve the evidence for root-causing.
However, there may still be times when you may need to try to debug in production - for example, you may be struggling to reproduce a problem locally or in a dev environment, and production may be the only place where it happens reliably enough. In this situation, redeploying with additional logging enabled may not be an option, especially if there's an incident in progress. There may be other times when an error isn't enough of a problem to impact your SLO, but you still want to fix it.
In the past, these situations required developers to add additional instrumentation to their code and wait for a new deployment for that instrumentation to show something useful. But what if that wasn't necessary? What if you could just inspect the code in production or add logging on the fly without having to redeploy?
Stackdriver Debugger is intended to enable exactly this. I wanted to try it for myself - here's how it went.
Setup
Agent
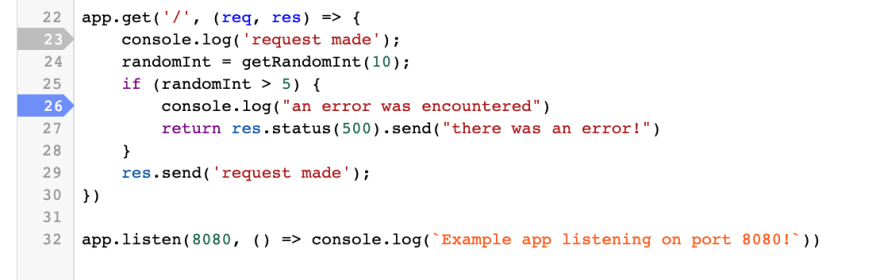
I started by writing a simple Node Express app that would return a 500 error half the time based on a random number generator. In order to use Debugger, I included the agent at the top of my code:
require('@google-cloud/debug-agent').start({
    projectId: projectID,
    keyFilename: './key.json',
    serviceContext: {
      service: serviceName,
      version: serviceVersion
    },
    allowExpressions: true
  });
Some things of note here:
- The agent takes the project ID and credentials as parameters. The latter is not necessary if running somewhere where access to the Debugger API doesn't need explicit authentication, like GCE, GKE, or App Engine. My plan was to simply run this locally, so I needed to add it explicitly.
- The service and version parameters allow you to have multiple services available to debug at the same time
- The allowExpressions flag enables Debugger to, for example, view static or global variables that are not part of the local variable set.
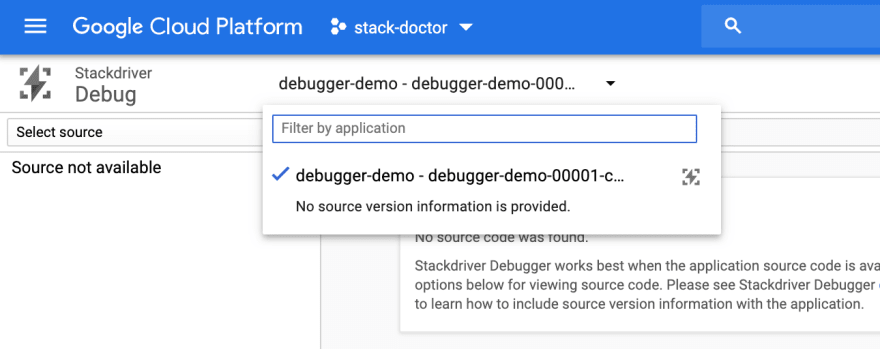
Once I ran the code, I was able to select my app and the specified version:

Code
At this point, I was presented with a screen to select my source code.
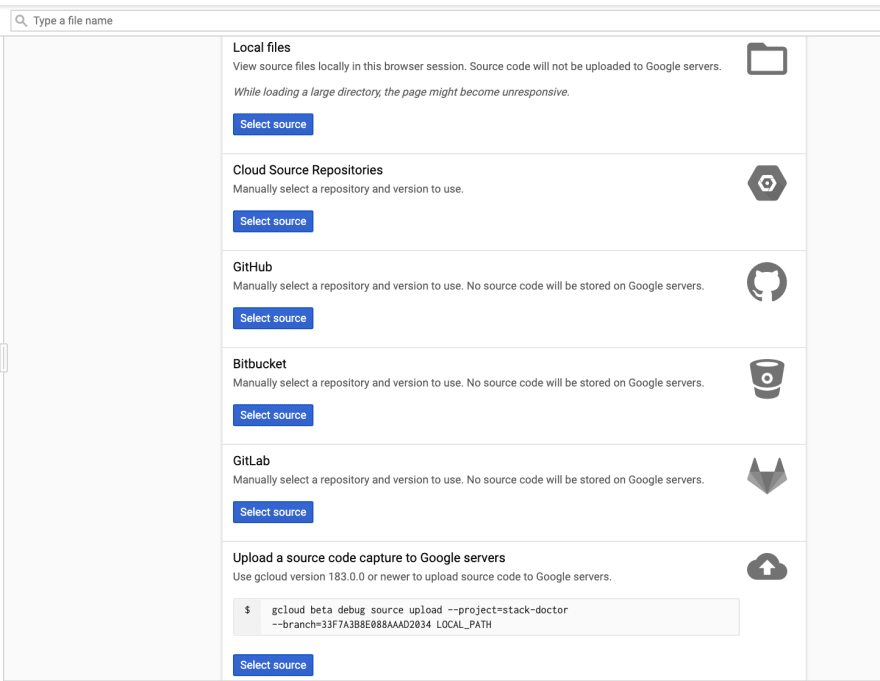
Because my code is in GitHub, I chose that path. Once I selected my repo and branch, I was able to see the code!

Debugging
Snapshots
At this point, I was ready to start actually using Debugger. The first capability it provides is Snapshots - it's the ability to see the value of variables at a specific execution point - again, without actually stopping code execution. Specifically, I wanted to see if I could get it to show me the value of my randomInt variable that I was using to trigger an error. I added a snapshot by clicking on the line number:

I then refreshed the page running on my local server until I got an error and got a snapshot:
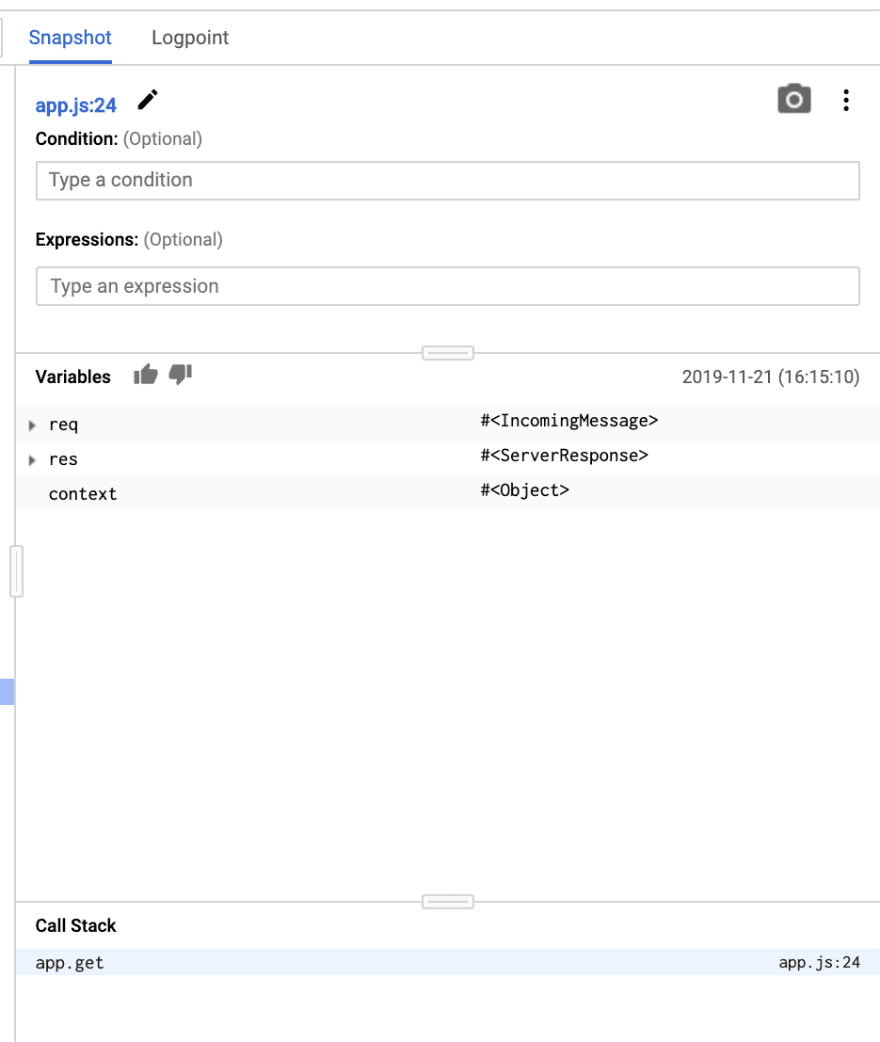
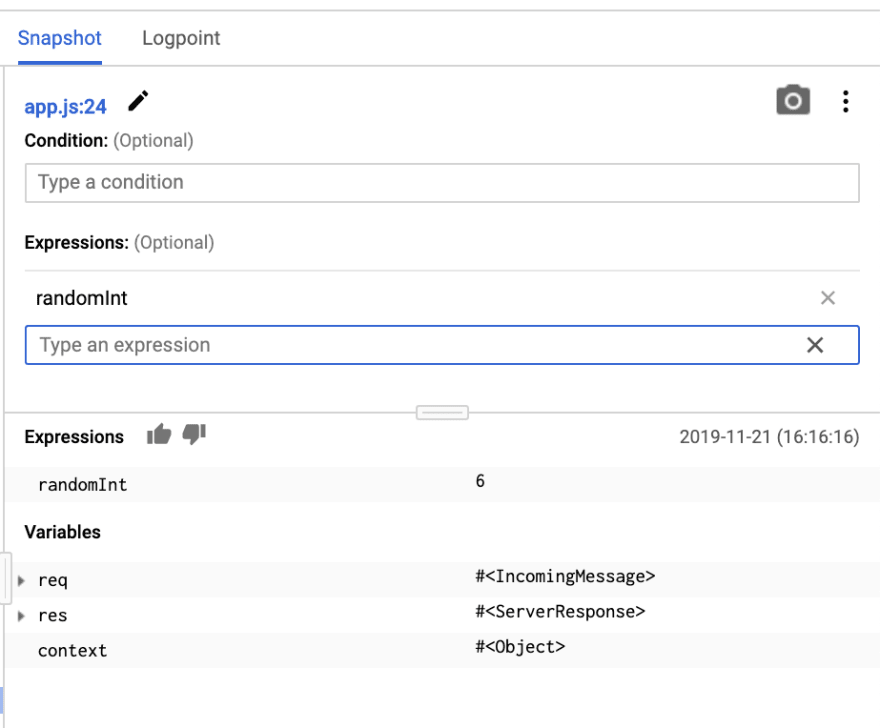
I was curious about the fact that my randomInt variable didn't show up. After a bit of digging, I realized that I had to add an expression to capture it:

This time, when I loaded the page, it was captured as I expected:
I was very happy with this - I can definitely see how useful this would be in a production debugging or troubleshooting scenario to, for example, capture the values that are being used in a calculation. I can even add multiple snapshot points and see the value of the variable change:
Logpoints
The second major capability of Debugger is the ability to add logging on the fly - that is, to essentially create additional log entries that get ingested into Stackdriver Logging and persist for 24 hours. Adding one is as easy as switching to the Logpoint tab, selecting a line of code, and specifying the message to be written:

Now, when I reloaded the page, I saw additional logging in my local console:
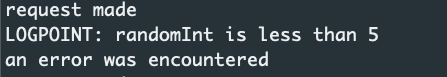
So, the log entries were added to stdout - not automatically sent to Stackdriver Logging. So, I needed to run this somewhere in GCP. I built a container image using Google Cloud Build and deployed it to Cloud Run. Once that was done, I saw my new service in Debugger:
I then selected the code from GitHub again and added a logpoint. This time, I got logs!
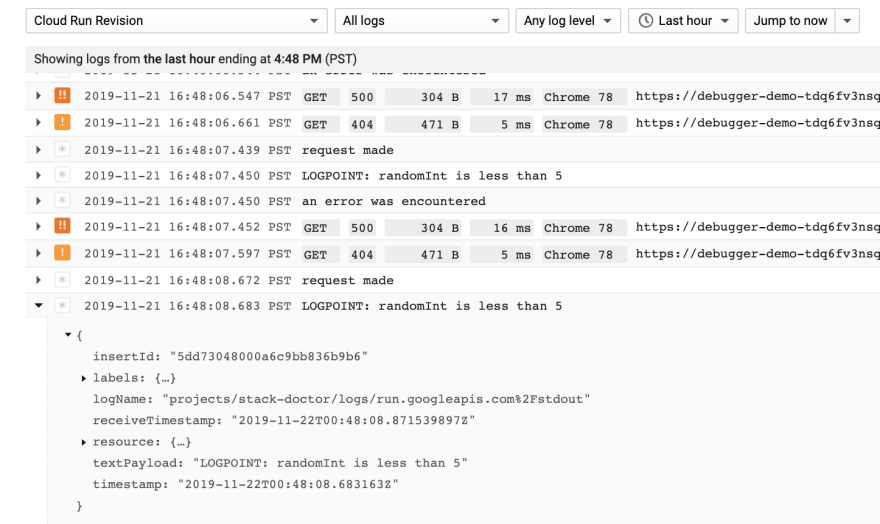
This is very cool - it's such an easy way to get more debugging info - without having to redeploy the app!
In conclusion…
Debugging in production CAN be done! Debugger is obviously not a replacement for being able to step through the code in an IDE (although it does have IDE integration), but it's a great way to add more debugging information to an app on the fly - without having to redeploy. Thanks for reading!


Top comments (0)