Introduction
One of the more common questions I hear from folks who are using either or both Stackdriver Logging and Monitoring is "how do I create an alert on errors in my logs?" Generally, they ask for one of two reasons:
- They really want to be notified every time an error is logged - as you might expect, this is an opportunity for me to talk to them about reliability targets, SLOs, and good alerting practices.
- They use logs as a kind of SLI and really do need to be alerted when the number of messages that meet some criteria (e.g. errors) exceeds a particular threshold.
In this post, I am going to address the latter scenario. I'll start by covering what logs and metrics are typically used for and the kinds of data they contain. From there, I'll review creating metrics from logs in Stackdriver and using those metrics to create charts in dashboards and alerts.
Note that a lot of this information is already covered in the documentation and in this excellent blog post by Mary Koes, a product manager on the Stackdriver team. Nevertheless, this is my attempt to create a single coherent story with practical examples of how to get started with log-based metrics in Stackdriver.
Logs and metrics
Before we start, it's important to have a common understanding of exactly what we mean when we talk about logs and metrics. Together, they are two of the three pillars (with traces being the third) of observability.

Note that I am generally referring to "observability 1.0" here. I will readily defer to folks like Charity Majors and Liz Fong-Jones on the current state of the art where observability is concerned. You can start with reading Charity's retrospective here, and Ben Sigelman's addressing the idea of the three pillars directly here.
With that sorted - let's get back to the issue at hand. We use logs as data points that specifically describe an event that takes place in our system. Logs are written by our code, by the platform our code is running on, and the infrastructure we depend on (for the purposes of this post, I'm leaving audit logs out of scope, and I will return to them directly in a separate post). Because logs in modern systems are the descendant of (and sometimes still are) text log files written to disk, I consider a log entry, analogous to a line in a log file, to be the quantum unit of logging. An entry will generally consist of exactly two things - a timestamp that indicates either when the event took place or when it was ingested into our logging system and the text payload, either as unstructured text data or structured data, most commonly in JSON. Logs can also carry associated metadata, especially when they're ingested into Stackdriver, like the resource that's writing them, the log name, and a severity for each entry. We use logs for two main purposes:
- Event logs describe specific events that take place within our system - we may use them to output messages that assure the developer that things are working well ("task succeeded") or to provide information when things are not ("received exception from server").
- Transaction logs describe the details of every transaction processed by a system or component. For example, a load balancer will log every request that it receives, whether it was successfully completed or not, and include additional information like the requested URL, HTTP response code, and possibly things like which backend was used to serve the request.
Metrics, on the other hand, are not generally thought of as describing specific events (again, this is changing). More commonly, they're used to represent the state or health of your system over time. A metric is made up of a series of points, each of which includes the timestamp and a numeric value. Metrics also have metadata associated with them - the series of points, commonly referred to as a timeseries, will include things like the name, description, and often labels that help determine which resource is writing the metric.
In Stackdriver specifically, metrics are the only kind of data that can be used to create alerts via alerting policies. As such, it'll be important to understand how to use logs to create metrics - let's do that now.
Log-based metrics
The term "log-based metrics" is rather specific to Stackdriver, but the idea is rather straightforward. First, Stackdriver provides a simple mechanism to count the number of log entries per minute that match a filter - referred to as a "counter metric". This is what we'll use if we want to, for example, use load balancer logs as our service level indicator for availability of a service - we can create a metric that will count how many errors we'll see, and we'll use an alerting policy to alert when that value exceeds a threshold we deem acceptable. The process is documented here, but I find that a specific example is always helpful.
Counter metric - errors
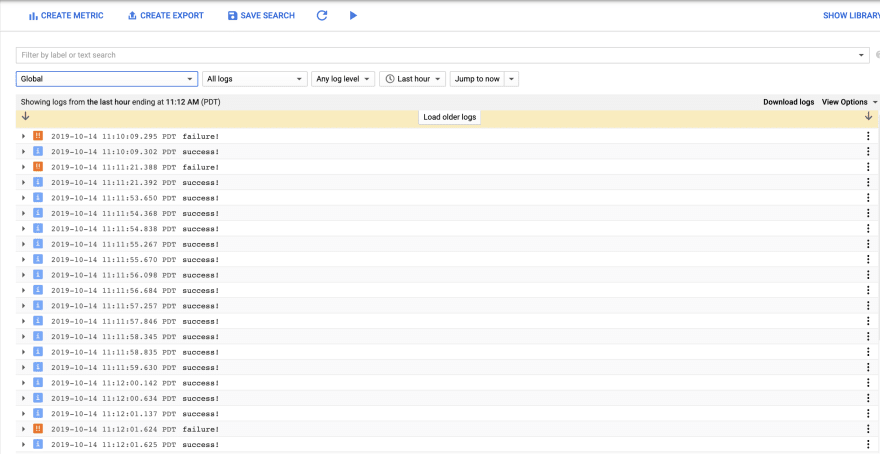
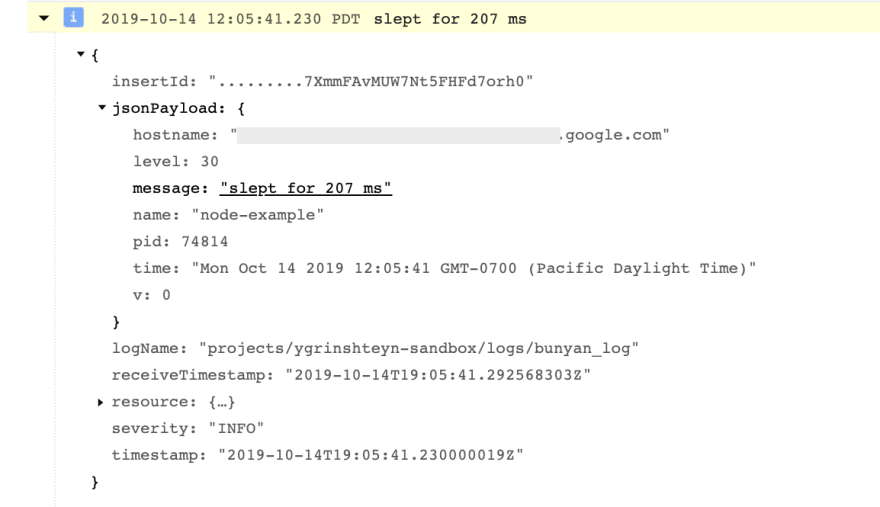
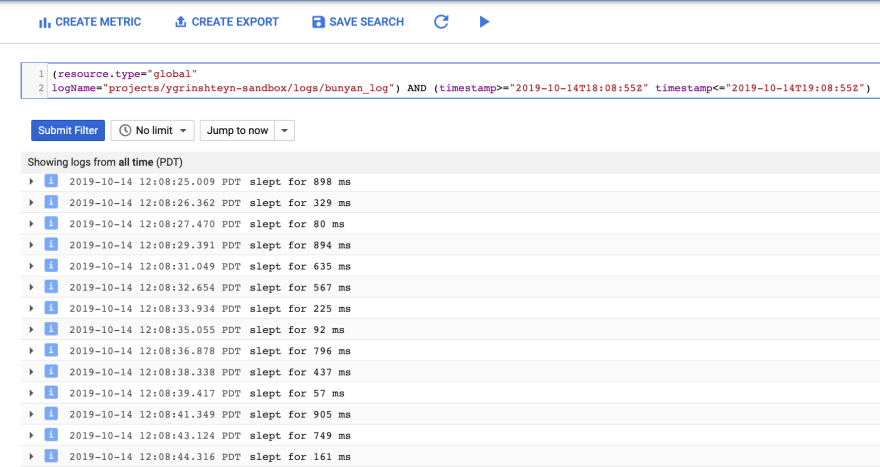
Let's take a look at a simple example. I've created a simple example that writes an error 20% of the time. When I run the code locally after authenticating through the Google Cloud SDK, here are the log entries:
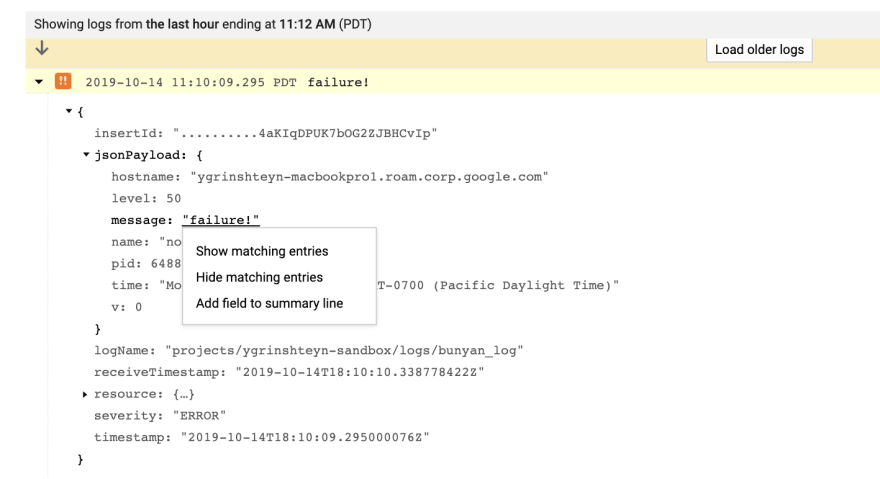
From here, I'd like to know when my error rate exceeds a particular threshold. First, I need to create a filter for all the logs that contain the error. An easy way is to expand the log, find the message I'd like to key on in the payload, click it, and select show matching entries.
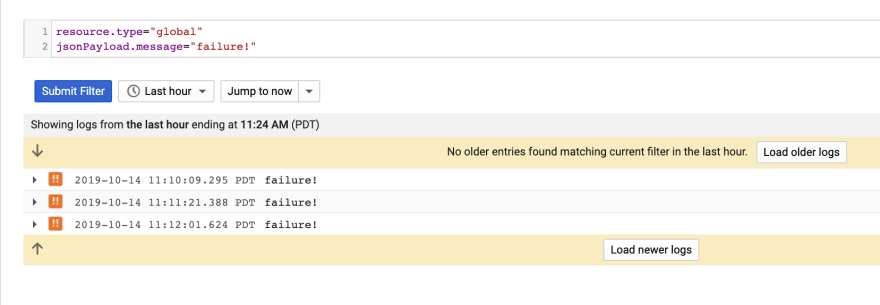
This creates an Advanced Filter and shows me the failure messages:
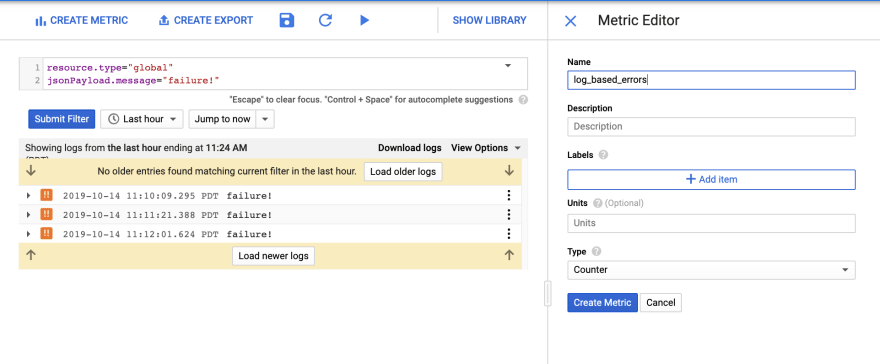
Next, I can use the Create Metric feature to create a Counter Metric:
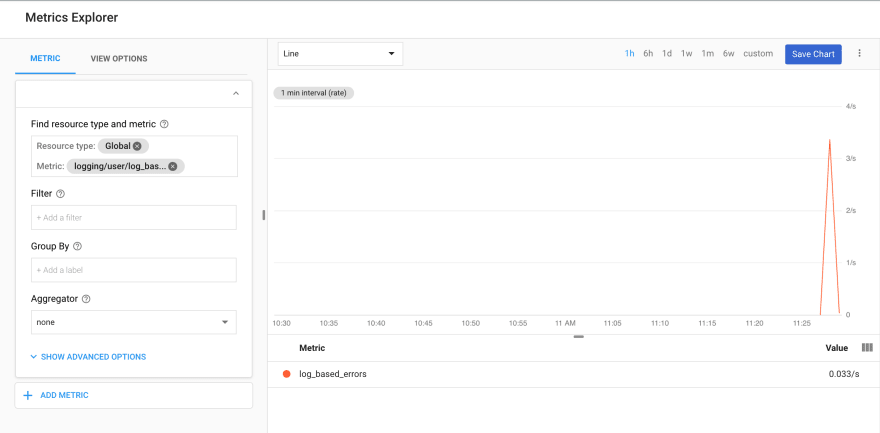
Once I click Create Metric, I can then go to Stackdriver Monitoring and see it there:
Distribution metric - latency
Now that you've seen how to create a simple counter metric that will track the number of errors per minute, let's take a look at the other reason we might want to use log-based metrics - to track a specific numeric value in the log payload. I've created a second example - this time, I'm introducing a randomly generated delay in the code and logging it as the latency. Here's what the payload looks like:
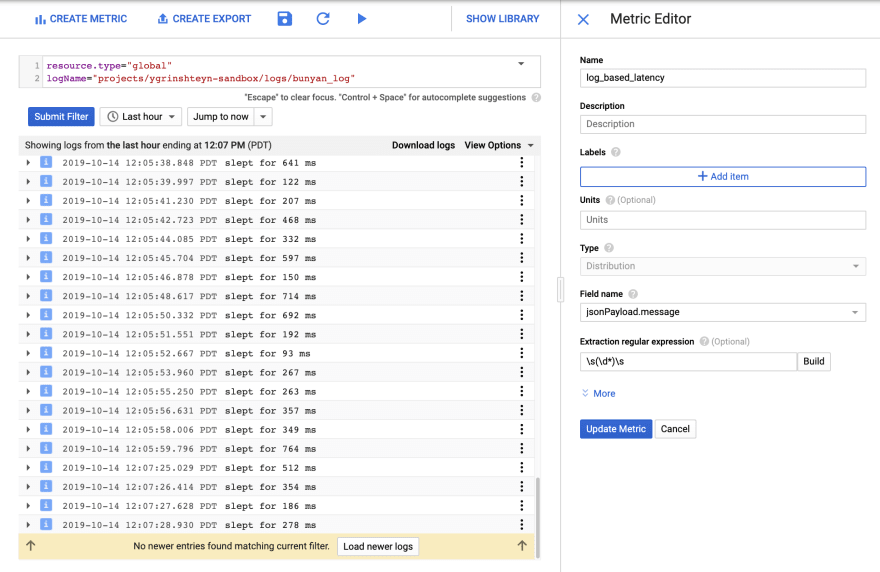
I want to create a metric that will capture value in the "message" field. To do that, I again use the "Show matching entries" feature and create a metric from the selection. I need to use a regular expression to parse the field and extract the numeric value. Note that I modified the selection filter to look for all the messages coming from my local machine, where the Node.js code is running, by using the logName filter.
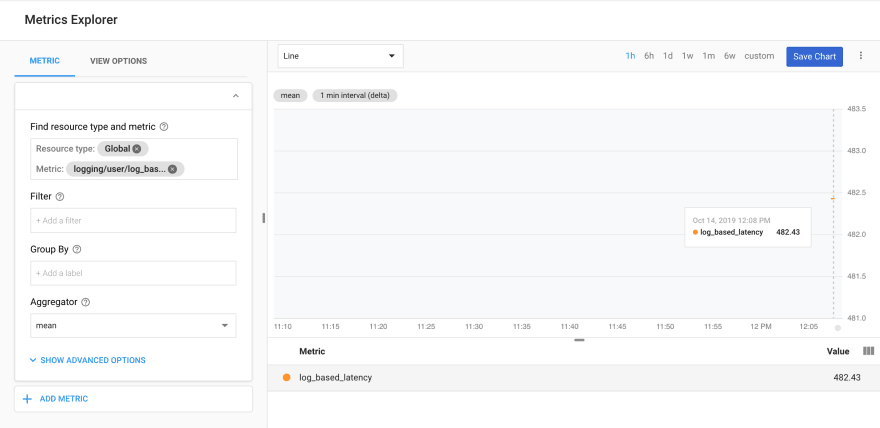
As before, I create the metric and view it in Metrics Explorer:
Using metrics
Now that we have our metrics created, we can use them just like any other metric in Stackdriver Monitoring. We can create charts with them and use them in Alerting Policies.
Charts
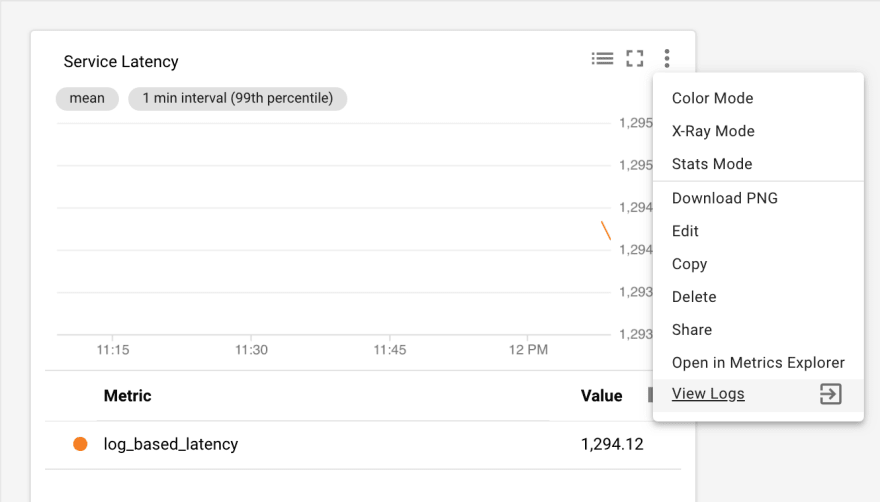
As an example, I created a chart for the latency I'm writing as a log value:

One great thing about log-based metrics is that you can easily see the logs that feed them. Click on the 3 dot menu for the chart and select View Logs:
The result is an advanced filter that shows you the logs that were ingested within the timeframe that the chart or dashboard were set to select:
Alerts
To address the original question raised at the start - we can also use our metrics as the basis for alerts. For example, if we wanted to know when our error rate exceeded a specific threshold, we can simply use our error metric in an alerting policy condition:
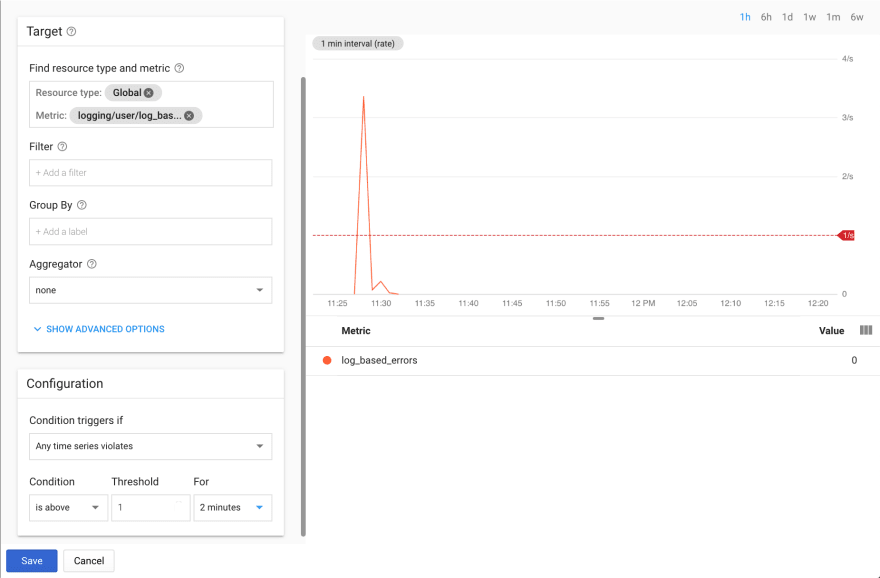
We can do the same for our distribution metric that captures latency:

Note that until a week or so ago, the documentation stated that alerting is not supported for distribution metrics - this is not true, and you can alert on distribution metrics by using a percentile aligner (with thanks to Summit for catching the documentation error).
Summary and conclusion
I hope that you now have a better understanding of how to create metrics from logs in Stackdriver and how you can use those metrics to visualize data with charts and create alerts with alerting policies. As always, I appreciate your feedback, questions, and ideas for topics to address in the future.

Top comments (0)