
The French government has published an opensource GIS website to keep an eye on the current epidemic growth.
They also publish the raw dataset but it's a mess to deal with, so let's just scrap the hell of the homepage.
BASE=https://dashboard.covid19.data.gouv.fr
FILE=$(curl -s $BASE | grep -Po '/_next/static/[^/]+?/pages/index.js' | head -n1)
JSON=$(curl -s $BASE/$FILE | grep -Po "JSON.parse\('\[.*?\]" | cut -c13- | sed 's/\\.//g')
You can now plot your 1-month worth of data using your favorite language or spreadsheet.
Paris data as CSV using jq:
echo "$JSON" | jq -r '.[] | select(.nom=="Paris") | [.date,.deces,.reanimation,.hospitalises,.gueris] |@csv'
Or if your a pipe junky, this bad boy will show you a New/Total logarithmic representation as shown in this video :
echo "$JSON" | node -e "
JSON.parse(require('fs').readFileSync('/dev/stdin').toString())
.filter(d=>d.nom=='France')
.map((d,i,a)=>({...d,sum:a.slice(0,i).reduce((a,c)=>a+(c.hospitalises||0),0)}))
.map((d,i,a)=>[d.sum,d.hospitalises-(a[i-1]||{}).hospitalises||0])
.forEach(l=>console.log(l.join(' ')))
" | graph -T png -lx -ly -X 'Total cases' -Y 'New cases variation' | display
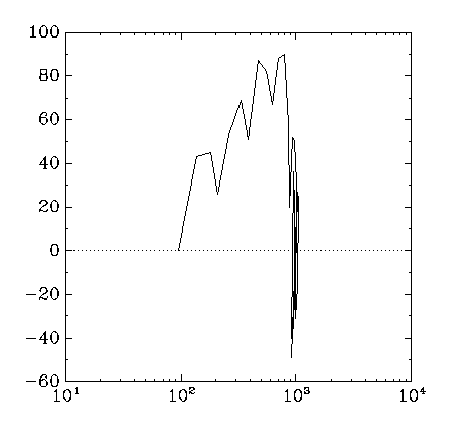
Here is the ouput for the whole country
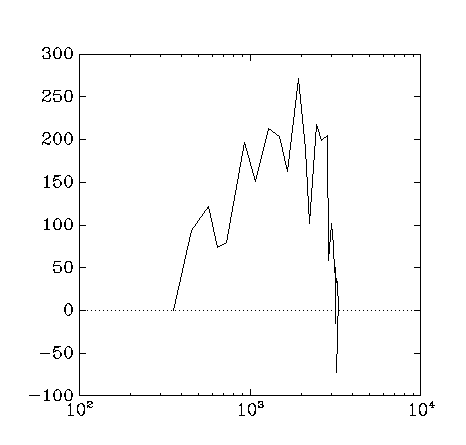
Here is the ouput for the Paris region

Top comments (1)
Really cool simple project.
I find "jq" really useful at times. That "graph" tool looks is awesome too. Is it this one?