Everybody likes a fast loading web page. In fact, Google has an entire section dedicated to performance and how companies are moving towards a faster web. Wouldn't it be good if we could measure some critical metrics like page load time in our production environment and constantly monitor them to find out where can be improved?
Navigation Timing API
Navigation Timing API is a JavaScript API which can be used to accurately measure performance on the client side. This data can then be transmitted to server side to allow real time monitoring of performance metrics.
The API provides a simple way to natively get accurate and detailed timing statistics for page navigation and load events. Metrics such as page load time, amount of time needed to unload the previous page, how long domain lookups take and so on can be measured by this API.
How to use it?
This API has two interfaces, Performance and PerformanceNavigationTiming. The window.performance property returns a Performance interface which is defined by High Resolution API, plus two additional properties:
- timing: data for navigation and page load events.
- navigation: how the user navigated to the page.
You can try this API in the browser's console (pressing Ctrl+Shift+J for Chrome on Windows or CMD+Option+J for Mac users):
> performance
And you will see an object like this:

Better alternative to Date object
Historically, we've used Date object for timing metrics like:
let start = Date.now();
And at the end of the page:
console.log(`It took: ${Date.now() - start} ms for the page to load!`);
However, this is very inefficient because of a couple of reasons. First, the timing code is on the page which takes time itself and affects performance. Besides, you should know that JavaScript time is not accurate. Furthermore, it wouldn't be close to what users experienced it, and worst of all, you can't use Date object, to measure network latency before the page started loading.
If you think of events which happen before the page even begins to load such as DNS resolution, redirects and server response time, technically you can't measure these by inline code since your code hasn't arrived yet.
Navigation Timing API FTW
Each of the properties of of performance.timing shows the time of navigation events such as when the page was requested 👉🏼 requestStart or page load events such as when the DOM began loading 👉🏼 domLoading in milliseconds since the midnight of Jan 1, 1970 UTC.
💡 A zero value means that the event didn't occur. Events such as redirectStart or secureConnectionStart might not happen at all.
For more information on these events, you can have a look at the W3C Recommendation.
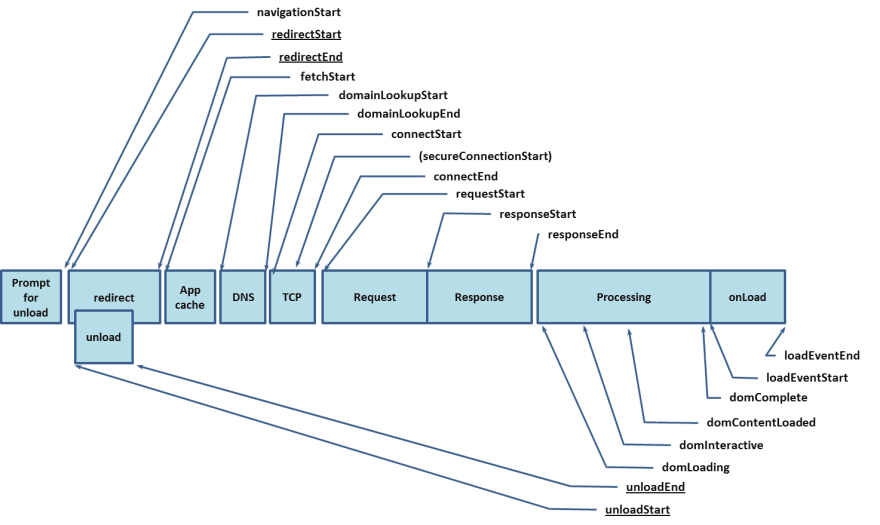
You can see the order of these events from the picture below from the above document:
Some use cases
Now let's have a look at how we can calculate some metrics using these useful properties.
Total page load time
In order to calculate the total page load time, you can use the loadEventEnd and navigationStart properties:
const perfObj = window.performance.timing;

let pageLoadTime = perfObj.loadEventEnd - perfObj.navigationStart;
Page render time
To calculate the total time taken to render the page, simply use domComplete and domLoading properties:
const perfObj = window.performance.timing;

let renderTime = perfObj.domComplete - perfObj.domLoading;
Request response time
To calculate the time between beginning of the request to the end of response retrieval, you can use:
const perfObj = window.performance.timing;

let renderTime = perfObj.responseEnd - perfObj.requestStart;
Network latency
If you want to measure network latency:
const perfObj = window.performance.timing;

let renderTime = perfObj.responseEnd - perfObj.fetchStart;
Navigation and page load together
To have the sum of navigation and page load time:
const perfObj = window.performance.timing;

let renderTime = perfObj.loadEventEnd - perfObj.navigationStart;
Pinpoint redirect problems
To find out about any issue in redirects:
const perfObj = window.performance.timing;

let renderTime = perfObj.redirectEnd - perfObj.redirectStart;
navigation property
There are many ways to end up on a page. If you want to know how your user ended up on your page, or how many redirects they've had before landing there, this property is your friend. performance.navigation has two properties:
- redirectCount: the number of times the document request was redirected.
- type: type of the navigation which lead to this page.
The type property is an enum which can have three values:
- 0: action by the user such as clicking a link or entering a URL in the browser address bar.
- 1: page reload.
- 2: navigation through going back and forth from history of the browser.
Summary
We saw how we can use the Navigation Timing API to get performance metrics on client side which can be sent to server to monitor performance of users in real time regardless of where they are and how they got there. This API is really powerful and has helped me a lot to help customers find out where they need to focus their energy to improve performance on which pages 😍.
Hope this has been helpful and till next time, au revoir 👋.

Top comments (1)
Nice article! And I'm happy to see there's broad browser support for the Navigation Timing API: developer.mozilla.org/en-US/docs/W...