
I've been owning an Apple Watch for more than a year now. It's a really impressive device, I've found myself recording all the Workouts I did pretty naturally.
Unfortunately, Apple's Activity app is far from ideal when you want to play with your data and display custom charts.
So I decided to try to improve that by downloading my data and put it in a dedicated product for data visualization.
Talking about it with my colleagues, they showed me Grafana and InfluxDB.
As I'm working daily with JavaScript and I wanted to build something quick, I went with Node.js to parse the raw data from my Apple Watch and insert it inside the InfluxDB database which is directly read by Grafana.
It was the first time I had to work with Node streams since the file to parse is huge. It was quite a challenge but exciting as well!
I had a lot of fun building it and it feels good to do something I find useful 😁
Hopefully, you'll like it to.
Please create your own dashboard and show it to me!
 yannbertrand
/
apple-watch-workouts-year-review
yannbertrand
/
apple-watch-workouts-year-review
Visualize your 2019 activity in a Grafana dashboard
Welcome to Apple Watch Workouts year review 👋


Stability: 1 - Experimental
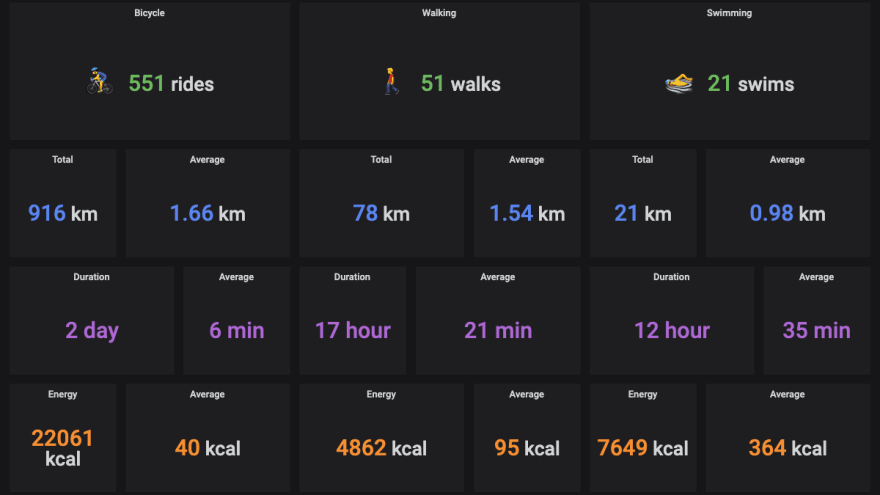
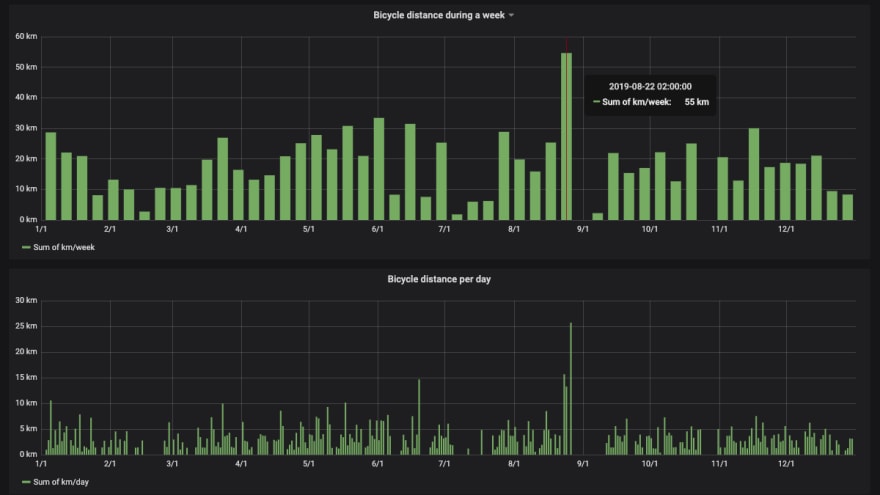
Visualize your Apple Watch workouts of the year in a Grafana dashboard
✨ Demo


🏗 Install
Clone the repo using Git. You'll need Docker, Node.js (tested with v12) and Yarn (tested with v1.21.1).
yarn install
🚀 Usage
The project runs an InfluxDB database and a Grafana instance, launch them with docker-compose:
docker-compose up -dIn the meantime, export your Apple Watch data from your iPhone. In the Health App:


Send the zip file to your computer.
Then run:
yarn start <path_to_export.zip>Grab a coffee while your data is read and inserted in InfluxDB (my data takes more than a minute to be loaded)!
This dashboard is just a proof of concept, take full advantage of Grafana, try to edit the panels…


Top comments (0)