Clusters in Azure Databricks can do a bunch of awesome stuff for us as Data Engineers, such as streaming, production ETL pipelines, machine learning etc.
Within Azure Databricks, there are two types of roles that clusters perform:
- Interactive, used to analyze data collaboratively with interactive notebooks.
- Job, used to run automated workloads, using either the UI or API.
We can create clusters within Databricks using either the UI, the Databricks CLI or using the Databricks Clusters API.
Creating Clusters
In Azure Databricks, we can create two different types of clusters.
- Standard, these are the default clusters and can be used with Python, R, Scala and SQL
- High-concurrency, these are tuned to provide the most efficient resource utilisation, isolation, security and performance for sharing by multiple concurrently active users. However, these type of clusters only support SQL, Python and R languages.
A high concurrency cluster is a managed cloud resource. The benefit of using this type of cluster is that they provide Spark-native fine-grained sharing for maximum resource utilization and minimum query latencies. This is achieved via:
- Preemption , proactively preempts Spark tasks from over-committed users to ensure everyone gets a fair share of the cluster and that the jobs they conduct complete in a timely fashion even when competing for time with other users.
- Fault isolation , creates an environment for each notebook, isolating them from each other.
Creating clusters is a pretty easy thing do to using the UI. In the side bar, click on the clusters icon. Then click on the Create Cluster button. You can then provide the following configuration settings for that cluster:
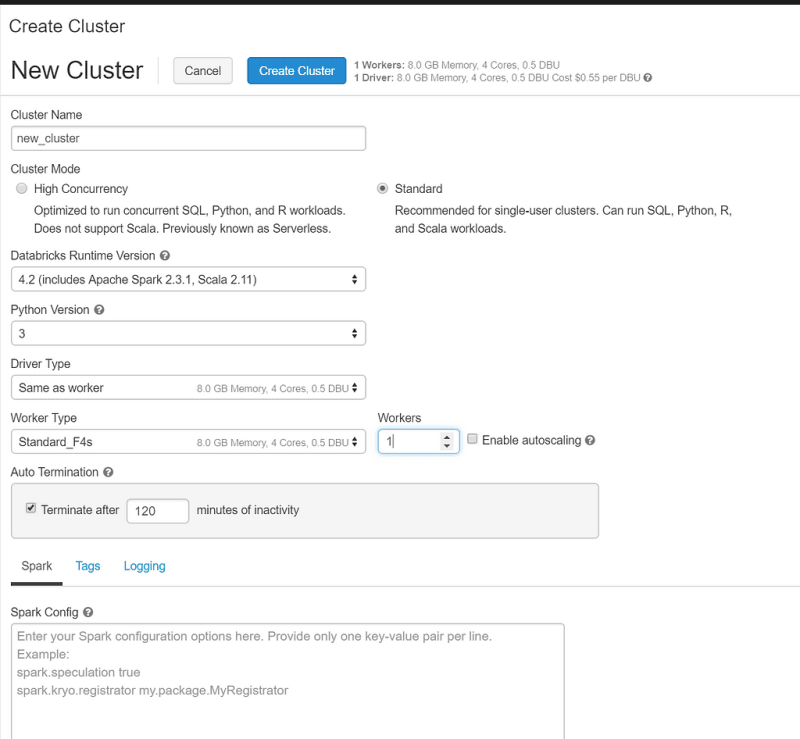
Just to keep costs down I’m picking a pretty small cluster size, but as you can see from the pic above, we can choose the following settings for our new cluster:
- Name
- Cluster Mode (High concurrency or standard)
- Databricks Runtime Version
- Python Version
- Driver Type
- Worker Type
- Auto termination
- Configuration Settings
We’ll cover these settings in detail a little later.
Displaying Clusters in Databricks
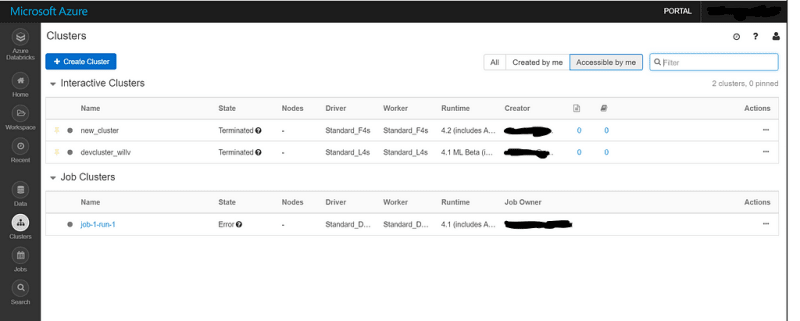
You can display your clusters in your Databricks workspace by clicking the clusters icon in the sidebar

As you can see from the picture above, we can see two lists within the Cluster page. One for Interactive clusters, another for Job clusters. Each list includes the following information:
- Cluster name
- The state of the cluster
- Number of nodes the cluster has
- The type of driver and worker nodes in the cluster
- What version of Databricks Runtime the cluster has
- Who created the cluster or the job owner of the cluster.
For interactive clusters, we can see the number of notebooks and libraries attached to the cluster. We can also view the Spark UI and logs from the list, as well as having the option of terminating, restarting, cloning or deleting the cluster. We can also set the permissions on the cluster from this list. We can also do some filtering to view certain clusters.
Basic Cluster Options
In the Cluster UI, we have a number of basic options that we can use against our clusters:
- We can clone a cluster. This allows us to almost copy and paste our existing clusters. When the cluster creation form opens, it is pre-filled with the configuration of the cluster that we are cloning. However, cluster permissions, installed libraries and attached notebooks are not included in its clone.
- We can edit a cluster’s configuration. Any libraries, jobs and notebooks attached to the cluster will remain attached to the cluster. However, if we edit a cluster, we have to restart the cluster before these changes take effect. If users are currently working with the cluster, this will affect them.
- We can start and terminate our clusters (switch them on and off). This just allows us to save money when we’re not using clusters and prevents us from having to configure them each time we start a cluster. When you restart a terminated cluster, Databricks re-creates the cluster with the same ID that it previously assigned to that cluster, installs all the libraries that were on that cluster and reattaches the notebooks. We can specify a period of activity when passed, the cluster will automatically terminate.
- Databricks retains the configuration for up to 70 interactive clusters terminated within the last 30 days and up to 30 job clusters terminated by the job scheduler. To keep this information for longer, we can pin a cluster in our cluster list. We can pin up to 20 clusters.
- We can also delete a cluster if we don’t need to use it again. You can’t undo this and you can’t delete a pinned cluster.
These actions can either be performed via the UI or programmatically using the Databricks API.
Event Logs
We can track cluster life cycle events using the cluster event log. These are events that are either triggered manually or automatically triggered by Databricks. The following events are captured by the log:
- CREATING
- STARTING
- RESTARTING
- TERMINATING
- EDITED
- RUNNING
- RESIZING (Includes resizing that we manually perform and auto resizing performed by auto-scaling)
- NODES_LOST (includes when a worker is terminated by Azure)
Events are stored for 60 days.
Let’s have a look at the log for our cluster. We can do this by clicking on it in our cluster list and then clicking the Event Log tab.

As you can see, I haven’t done a lot with this cluster. We can drill down further into an event by clicking on it and then clicking the JSON tab for further information.
Configuring our clusters
Let’s dive a bit deeper into the configuration of our cluster. Clusters consists of one driver node and worker nodes. We can pick memory-intensive or compute-intensive workloads depending on our business cases. In Azure Databricks, cluster node instances are mapped to compute units known as DBU’s, which have different pricing options depending on their sizes.
Driver nodes maintain the state information of all notebooks that are attached to that cluster. It also maintains the SparkContext and interprets all the commands that we run from a notebook or library on the cluster. It also runs the Spark master that coordinates with the Spark executors. When we stop using a notebook, we should detach it from the driver.
Worker nodes run the Spark executors and other services required for your clusters to function properly. If a cluster doesn’t have any workers, Spark commands will fail
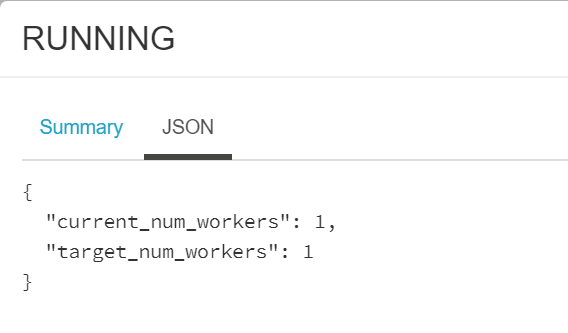
Sizing our clusters and Autoscaling
When we create clusters, we can provide either a fixed number of workers or provide a minimum and maximum range. When we fix the number of workers, Azure Databricks ensures that the cluster has this number of workers available. If we provide a range instead, Databricks chooses the number depending on what’s required to run the job.
This is enabled through Autoscaling. There will be times where some jobs are more demanding and require more resource than others. Databricks automatically adds workers during these jobs and removes them when they’re no longer needed. Autoscaling provides us with two benefits:
- Workloads run faster compared to clusters that are under-provisioned.
- Autoscaling clusters can reduce overall costs compared to static-sized ones.
Databricks will monitor load on our clusters and will decide to scale them up and down and by how much. If we have pending Spark tasks, the cluster will scale up and will scale back down when these pending tasks are done.
Cluster Tags and Log Location
We can monitor the cost of our resources used by different groups in our teams and organizations (Great for when the interns feel like spinning up some massive GPU clusters for kicks). We specify tags as key-value pairs when we create clusters, and Azure Databricks will apply these tags to cloud resources.
We can specify a location of our cluster log when we create the cluster. This is delivered to the chosen destination every five minutes.
GPU-enabled Clusters
Azure Databricks also support clustered that are accelerated with graphics processing units (GPU’s). This is pretty useful when we want to smash out some deep learning.
Creating GPU clusters is pretty much the same when we create any Spark Cluster. We just need to keep the following things in mind when creating them:
- The Databricks Runtime version for the cluster must be GPU-enabled.
- Both the Worker and Driver Type must be GPU instance types.
Azure Databricks installs the NVIDA software required to use GPUs on Spark driver and worker instances. When you select a GPU-enabled Databricks Runtime version in Databricks, you implicitly agree to the NVIDA EULA.
Databricks Runtime ML clusters
If you need an environment for machine learning and data science, Databricks Runtime ML is a pretty good option. It comes with multiple libraries such as Tensorflow. It ensures the compatibility of the libraries included on the cluster and decreases the start up time of the cluster compared to using init scripts.
You can check out the complete list of libraries included in Databricks Runtime here.
Bear in mind however that Databricks Runtime 4.1 ML clusters are only available in Premium instances.
Determining Access Control on our Clusters
Within Azure Databricks, we can use access control to allow admins and users to give access to clusters to other users. There are two types of cluster access control:
- Cluster creation permission. If you’re an admin, you can choose which users can create clusters.
- Individual cluster permissions. Users who can manage clusters can choose which users can perform certain actions on a given cluster.

We can enforce cluster configurations so that users don’t mess around with them. If you do need to lock that down, you can disable the ability to create clusters for all users then after you configure the cluster how you want it, you can give access to users who need access to a given cluster Can Restart permissions. This allows those users to start and stop clusters without having to set up configurations manually.
Using the Spark UI for Cluster Information
If we’re running Spark jobs from our notebooks, we can display information about those jobs using the Spark UI. We can also use the Spark UI for terminated clusters:

If we restart the cluster, the Spark UI is replaced with the new one.
Using Initialisation Scripts
We can use initialisation scripts that run during the startup for each cluster node before the Spark driver or worker JVM starts. These scripts apply to manually created clusters and clusters created by jobs. All you have to do is create the script once and it will run at cluster startup.
Databricks supports two types of init scripts: global and cluster-specific. Global init scripts will run on every cluster at startup, while cluster-specific scripts are limited to a specific cluster (if it wasn’t obvious enough for you).
The outputs of these scripts will save to a file in DBFS.
Creating global init scripts are fairly easy to do. However, just be careful what you put in these since they run on every cluster at cluster startup.
First we create the file directory if it doesn’t exist
dbutils.fs.mkdirs("dbfs:/databricks/init/")
Then we display the list of existing global init scripts
display(dbutils.fs.ls("dbfs:/databricks/init/"))
We then create the script. For local init scripts, we would configure a cluster name variable then create a directory and append that variable name to the path of that directory.
To delete a script, we can run the following command
dbutils.fs.rm("/databricks/init/my-echo.sh")
Libraries and Notebooks
As mentioned, we can view the libraries installed and the notebooks attached on our clusters using the UI. Understanding how libraries work on a cluster requires a post of its own so I won’t go into too much detail here.
We can see the notebooks attached to the cluster, along with their status on the cluster details page. When you stop using a notebook, you should detach it from the cluster to free up memory space on the driver.

Fin
In this blog post, I’ve outlined a few things that you should keep in mind when creating your clusters within Azure Databricks.
Just a general reminder, if you are trying things out remember to turn off your clusters when you’re finished with them for a while. You don’t want to spend money on something that you don’t use!
Remember to check out the Azure Databricks documentation for more up to date information on clusters.


Top comments (0)