
It’s fairly simple to work with Databases and Tables in Azure Databricks. Let’s start off by outlining a couple of concepts.
A database in Azure Databricks is a collection of tables and a table is a collection of structured data. Tables in Databricks are equivalent to DataFrames in Apache Spark. This means that:
- You can cache, filter and perform any operations on tables that are supported by DataFrames.
- You can also query tables using the Spark API’s and Spark SQL.
There are two types of tables in Databricks:
- Global Tables. These are available across all clusters. In Auzre Databricks, Global tables are registered to the Hive metastore.
- Local Tables. These are only available to the cluster to which it was created on and there are not registered to the Hive metastore. These are also known as temp tables or views.
In this blog post, I’m going to do a quick walk through on how easy it is to create tables, read them and then delete them once you’re done with them. If you want to follow along, you’ll need an Azure subscription and you’ll need to create a Databricks instance.
Creating tables
This is pretty easy to do in Databricks. You can either create tables using the UI tool they provide or you can do it programmatically. For this example, I’m going to use the UI tool.
Make sure that you create a cluster prior to doing this.
For this demo, I’m going to upload a csv file containing data on baseball players(You can also create tables from JSON and Arvo format). To add this file as a table, Click on the Data icon in the sidebar, click on the Database that you want to add the table to and then click Add Data

We now want to upload our file to DBFS. This is pretty simple, you can either drop the file under the file section or browse to the directory where you have the file.
You can create tables already existing in DBFS as a table and you can create tables from existing data sources such as Blob Storage.

Once you’ve done this, you can either create the table using the UI (which we’ll do) or create the table using a Databricks Notebook.
We’ll need to select a cluster to preview the table that we wish to create. Once you’ve done this using the drop down, click Preview Table.
Now we can specify the table attributes that we want to give. We can specify a name, which database we want to add the table to, what the file type is and whether or not we want to infer the schema from the file.
While this will do most of the heavy lifting for us, we can specify data types, column names etc. using the table UI editor.
Once you’re happy with everything, click the Create Table button.

You should then see the created table’s schema and some sample data.

Read a table
Now that we have our table, let’s create a notebook and display our baseball table. For this example, I’m going to use Scala.
This is a fairly simple process. On my cluster I’ve got a couple of databases, so I’ve used a bit of Spark SQL to use our default database like so
%sql

USE default;
Databricks supports Scala, SQL, Python and R. You can use multiple languages within a notebook as well as shell, markdown and file system commands. Just for this example, let’s go back to using Scala.
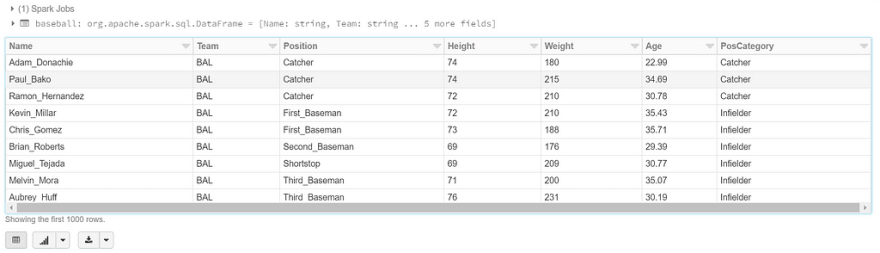
To read a table and display it’s contents, we can type out the following Scala code:
val baseball = spark.table("baseball")
display(baseball.select("\*"))
This will just select everything in our table (much like a SQL SELECT * query). Here’s our output (This will usually limit the output to 1000 rows):
From here, we can what I call ‘cheap’ visualizations to get a better sense of our data. We can connect Databricks to visualization tools such as Power BI or Tableau, but if we want to quickly do things in Databricks, that option is open to us as well.
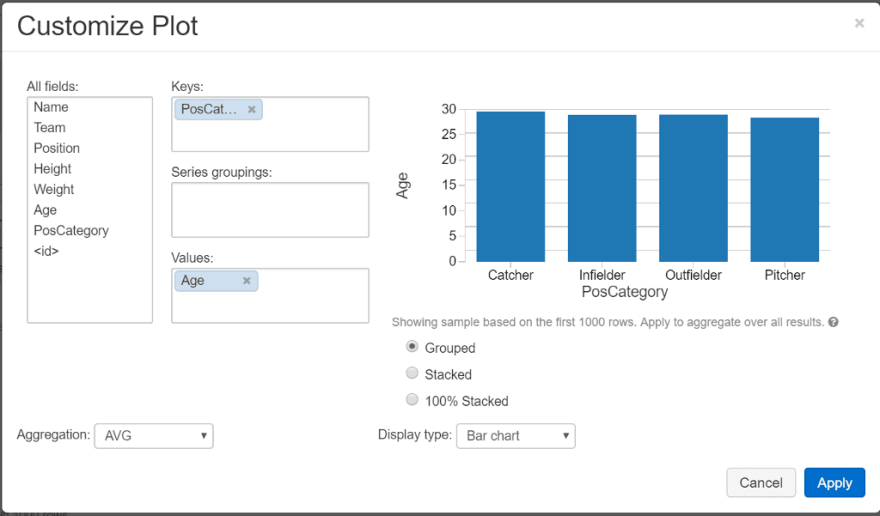
Let’s use an example of seeing what the average age of baseball is between different position categories (PosCategory). We can do this by clicking the plot button underneath our data, which will open the customise plot UI.
In this UI, we can choose our axis for our plots, what type of aggregation we want to perform and what type of charts that we want to use.
Once we’re done, click Apply to finalise your plot.
Like I said, it’s a pretty cheap way of doing some simple visuals if you need to. You can import different visualisation libraries in your Databricks notebooks if you wish, but I’ll cover that another time.
Updating tables
The schema that we use for our tables are immutable (unable to be changed). However, we can update the data in our tables by changing the underlying file. Once we have done this, we can refresh the table using the following Spark SQL command:
%sql

REFRESH TABLE baseball;
When we access the table, this will let Spark SQL read the correct files even if they change.
Deleting tables
Now that we are done with our table, we can delete it. Again, we can either use the UI to do, or do this programmatically. Let’s use the latter option to do this. All we need to do here is a simple Spark SQL operation:
%sql

DROP TABLE baseball;
Once this is done and we then try to display our table again, we’ll get the following error:

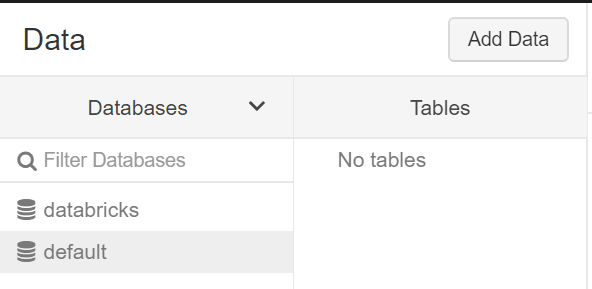
We can also see from the UI that our table no longer exists:
Fin
This was a quick guide on how you can start creating tables within Azure Databricks. Hopefully you can see that it’s relatively easy to get a quick example going. There’s so much more you can do with tables in Databricks and I’ll cover those finer details in a future post.

Latest comments (0)