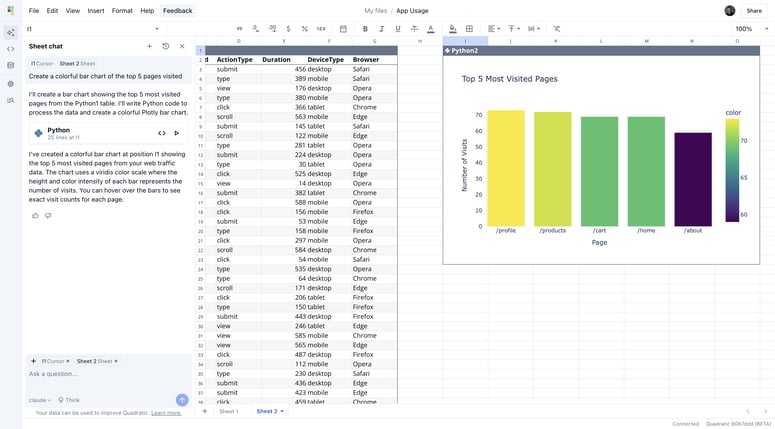
Here are 20 JavaScript libraries for data visualization in 2025, categorized into Charting, Mapping, 3D, and Graph/Network visualization
Charting Libraries (For bar, line, pie, and other standard charts)
- Chart.js – Simple, flexible, and widely used.
- D3.js – Powerful, custom, and interactive visualizations.
- Recharts – React-based, easy-to-use chart components.
- Apache ECharts – Scalable, fast, and ideal for big data.
- Highcharts – Feature-rich, supports real-time updates.
Mapping Libraries (For interactive maps and geospatial data visualization)
- Leaflet – Lightweight and ideal for basic maps.
- Mapbox GL JS – WebGL-powered, highly customizable.
- Google Maps JavaScript API – Well-integrated with location services.
- OpenLayers – Robust mapping with vector and raster layers.
- Deck.gl – High-performance 2D & 3D geospatial data visualization.
3D Visualization Libraries (For immersive, WebGL-based 3D graphics)
- Three.js – The most popular library for 3D rendering.
- Babylon.js – Advanced game engine and visualization.
- A-Frame – VR and 3D visualization in HTML.
- X3DOM – Integrates 3D graphics into web pages.
- PlayCanvas – WebGL-powered interactive 3D content.
Graph & Network Visualization Libraries (For social networks, relationships, and connections)
- Cytoscape.js – Ideal for graph theory and networks.
- Sigma.js – Lightweight, great for large-scale graphs.
- Vis.js – Handles networks, timelines, and hierarchical data.
- Graphology – Robust library for network analysis.
- Algebra.js – Handles mathematical graph structures.
This selection covers charts, maps, 3D visualizations, and network graphs, ensuring a solid range of visualization needs.
Thanks for reading to the end — you’re awesome! 🙌
Let’s grow, learn, and build amazing things together! 🚀
Don’t forget to like, save it to your list, and follow me.
Stay connected with me on my other platforms:


Top comments (9)
Vue flow, react flow for graph and tree
Thanks for sharing,
Does anyone else have any recommendation that I have missed, can share here.
Let's grow together.
If you don't know all 20, you are unemployable 😏
🚀 Just finished my very first frontend challenge for Dev Community!
dev.to/web_dev-usman/discover-your...
Give your feedback there, and support me.
Awesome !
Thanks!
Also support me to win this frontend challenge,
here is the link.
dev.to/web_dev-usman/discover-your...
Make sure to share it with your circle for more exposure.
Good 😍
Echarts is easy to custom
Wow!, deeply appreciated
Some comments may only be visible to logged-in visitors. Sign in to view all comments.