Apache Age is an open-source graph database that supports the Cypher query language. It allows users to store and query graph data using Cypher queries. One of the advantages of Apache Age is its ability to provide visualization of graph data. In this article, we will discuss the visualizations available in Apache Age.
Apache Age allows users to customize the visualization of their data. The first customization is the form in which the data is presented, either in a table or a graph. Users can pass the data to Apache Age using Cypher queries, and then use the graph or table visualization to view the data.
For example, let's say we have the following data:
` #These queries to make a label of Person and then adding properties to it.
CREATE (n:Person {name : "imran", bornIn : "Pakistan"})
CREATE (n:Person {name : "ali", bornIn : "Pakistan"})
CREATE (n:Person {name : "usama", bornIn : "Pakistan"})
CREATE (n:Person {name : "akabr", bornIn : "Pakistan"})
CREATE (n:Person {name : "james", bornIn : "US"})
CREATE (n:Person {name : "david", bornIn : "US"})

# These queries to make a label of COuntry and adding name property to it.
CREATE (n:Country{name : "Pakistan"})
CREATE (n:Country{name : "US"})

#Relationship between these two vertexes
MATCH (a:Person), (b:Country) WHERE a.bornIn = b.name CREATE (a)-[r:BORNIN]->(b) RETURN r
`
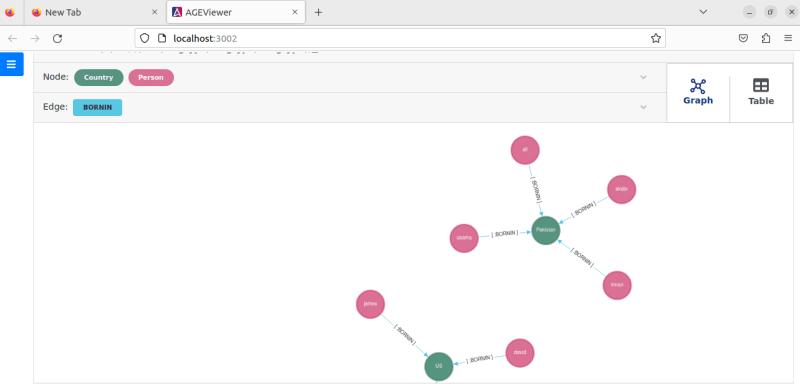
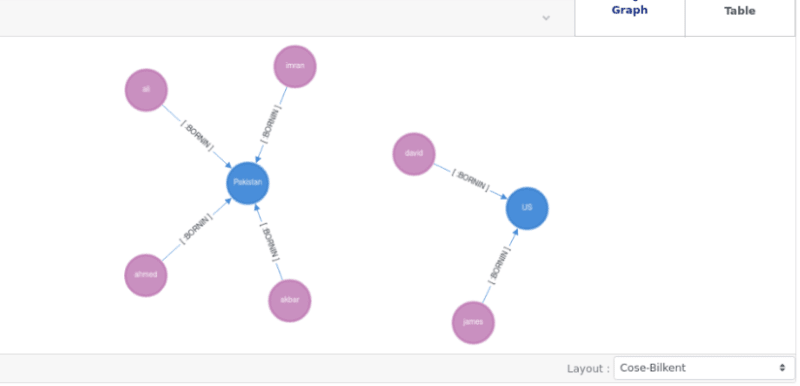
We can then visualize this data in a graph form as shown below:
Apache Age Graph Visualization:
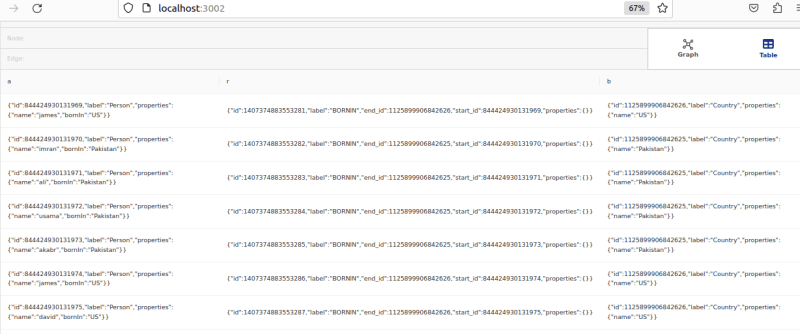
We can also visualize the same data in a table form as shown below:
Apache Age Table Visualization:
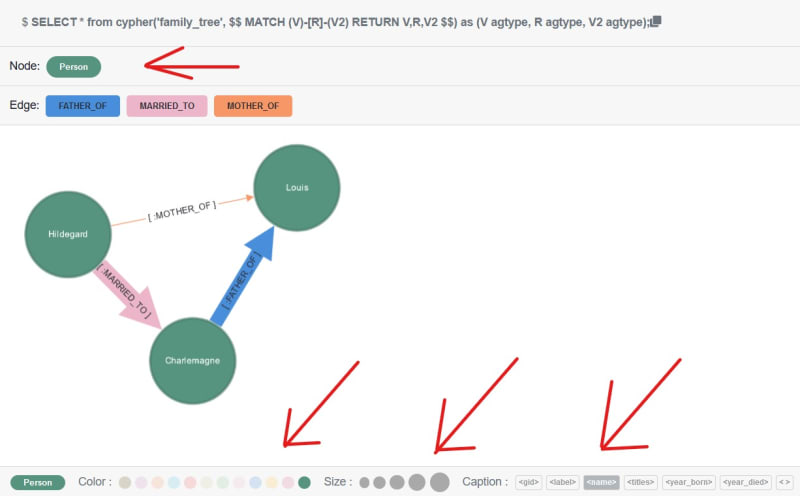
Color Customization:
Apache Age also allows users to customize the colors of nodes and edges by clicking on them. Users can also change the size and type of caption written on the nodes or edges.
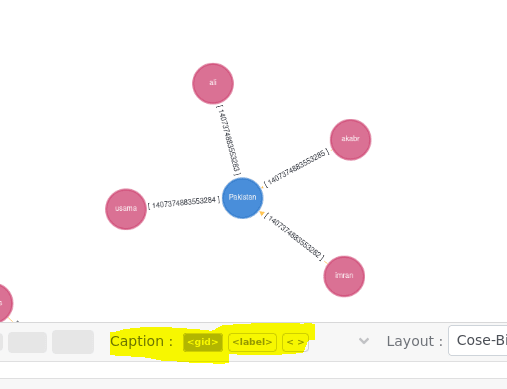
We can add extra information by changing the query. For example, in the graph visualization shown above, we changed the edge connection label to gid.
Layout:
Additionally, Apache Age provides layout options such as Klay, Euler and Cose Bikent etc that allow users to change the graph view.
Conclusion:
In conclusion, Apache Age provides users with customizable visualization options for their graph data. Users can choose to view their data in either a graph or table form and can customize the colors, size, and type of caption written on the nodes and edges. Apache Age's layout options provide users with additional options to view their data in various ways.

Top comments (0)