I need a solid declarative diagramming library or tool that I can invest time in. I always wanted to learn Haskell’s diagrams library. In this post, I will give it a try.
Motivation
I like drawing. Most people I know are visual people. I decided to find a decent diagramming tool which I can integrate in both my workflow and programs.
I can go two ways:
- Use a low-level language like TikZ and hate my life (I did before), or
- Use a high-level language like Plant UML, D2, Graphviz which are good for the purpose they are designed for, but not for generic purpose diagramming.
I think that I need something in between. Recently, I was checking typst. It is quite impressive. But I am not sure if I need a better LaTeX.
I have been seeing the diagrams Haskell library for a while. I know, it is quite low-level to use for occassional reasons, but high-level and generic enough to use in a program. It is time to give it a try.
Getting Our Hands Dirty
This blogpost is written in Literate Haskell. All the images produced in this post are generated by this post itself evertime I (or GitHub Action) build this blog. You can check the source code of my blog.
Let’s start…
I am simply going to add diagrams to my Haskell dependencies along with the markdown-unlit program.
{
  ##...

  ghc = pkgs.haskellPackages.ghcWithPackages (hpkgs: [
    ## ...
    hpkgs.diagrams
    hpkgs.markdown-unlit
    ## ...
  ]);

  thisShell = pkgs.mkShell {
    buildInputs = [
      ## ...

      ghc

      ## ...
    ];

    NIX_GHC = "${ghc}/bin/ghc";
    NIX_GHCPKG = "${ghc}/bin/ghc-pkg";
    NIX_GHC_DOCDIR = "${ghc}/share/doc/ghc/html";
    NIX_GHC_LIBDIR = "${ghc}/lib/ghc-9.6.5/lib";
  };

  # ...
}
diagrams tutorial says that we may need to enable some language extensions. But we will not need them in this port. We just need some imports:
import Diagrams.Backend.SVG
import Diagrams.Prelude
import System.Environment (getArgs)
We will generate 11 SVG diagrams in this tutorial. Let’s implement our entry point:
main :: IO ()
main = do
  dir <- head <$> getArgs
  render dir "diagram1.svg" diagram1
  render dir "diagram2.svg" diagram2
  render dir "diagram3.svg" diagram3
  render dir "diagram4.svg" diagram4
  render dir "diagram5.svg" diagram5
  render dir "diagram6.svg" diagram6
  render dir "diagram7.svg" diagram7
  render dir "diagram8.svg" diagram8
  render dir "diagram9.svg" diagram9
  render dir "diagram10.svg" diagram10
  render dir "diagram11.svg" diagram11
  where
    render dpath fname = renderSVG (dpath <> "/" <> fname) (mkSizeSpec2D (Just 400) Nothing) . frame 0.2
This is how we will invoke it:
runhaskell \
  -pgmLmarkdown-unlit \
  content/posts/2024-08-09_haskell-diagrams-intro.lhs \
  static/assets/media/posts/haskell-diagrams-intro
Let’s start with a triangle:
diagram1 :: Diagram B
diagram1 =
  triangle 1

We can use the ||| function to place two triangles side by side:
diagram2 :: Diagram B
diagram2 =
  triangle 1 ||| triangle 1

How about putting a list of shapes side by side separated by a gap?
diagram3 :: Diagram B
diagram3 =
  hsep 0.2 $
    [ triangle 1
    , triangle 1
    ]

diagrams has a concept of origin. We can show the origin of a diagram by using the showOrigin function:
diagram4 :: Diagram B
diagram4 =
  showOrigin $ triangle 1

It works for the shapes composed together as well:
diagram5 :: Diagram B
diagram5 =
  showOrigin . hsep 0.2 $
    [ triangle 1
    , triangle 1
    ]

But that is a little strange, right? Why is the origin not in the center of the composed shape, but of the first shape?
This is how hsep works. It does not shift the origin to the center of the composed shape. We can use the centerX function to shift the origin to the center of the resulting diagram along the x-axis:
diagram6 :: Diagram B
diagram6 =
  showOrigin . centerX . hsep 0.2 $
    [ triangle 1
    , triangle 1
    ]

How about adding a vertical line between the triangles?
diagram7 :: Diagram B
diagram7 =
  centerX . hsep 0.2 $
    [ triangle 1
    , vrule 1
    , triangle 1
    ]

OK, but why is the vertical line not centered? Let’s check the origins for these 3 shapes:
diagram8 :: Diagram B
diagram8 =
  (ruler 2) `atop` diagram
  where
    ruler  = dashingN [0.02, 0.02] 0 . hrule
    diagram = centerX . hsep 0.2 $
        [ showOrigin $ triangle 1
        , showOrigin $ vrule 1
        , showOrigin $ triangle 1
        ]

Of course! The origin along the y-axis is anchored to the first shape’s origin that is a triangle. And the center of this equilateral triangle is not the center of its height. See your nearest analytical geometry book for details!
Let’s align the shapes at to the top of the shapes:
diagram9 :: Diagram B
diagram9 =
  centerX . (composeAligned alignT (hsep 0.2)) $
    [ triangle 1
    , vrule 1
    , triangle 1
    ]

Good! let’s connect the top points of the triangles with a horizontal line of length 0.5 + 0.2 + 0.2 + 0.5:
diagram10 :: Diagram B
diagram10 =
  hrule 1.4 === diagram9

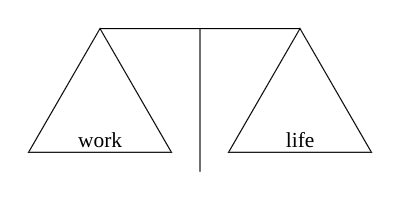
OK, now the final diagram attempt which will render some text inside the triangles:
diagram11 :: Diagram B
diagram11 =
  hrule 1.4 === hcom
  where
    work = triangle 1 === scale 0.15 (alignedText 0.5 0 "work")
    life = triangle 1 === scale 0.15 (alignedText 0.5 0 "life")
    hcom = centerX . (composeAligned alignT (hsep 0.2)) $ [work, vrule 1, life]
Wrap-Up
In this tutorial, we glimpsed through the basics of the diagrams library.
Now that we have established work-life balance, I can get ready for the next chapter of my life with diagrams.


Top comments (0)