In this article, we are going to see the use cases of Confusion Matrix and its impact on Cyber Security.
Confusion Matrix
A confusion matrix is a table that is often used to describe the performance of a classification model on a set of test data for which the true values are known. The confusion matrix itself is relatively simple to understand, but the related terminology can be confusing.

There are two possible predicted classes: "yes" and "no".
If we were predicting the presence of a disease, for example, "yes" would mean they have the disease, and "no" would mean they don't have the disease.
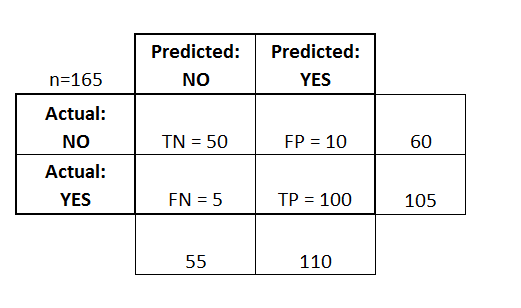
The classifier made a total of 165 predictions in which
Out of those 165 cases, the classifier predicted "yes" 110 times, and "no" 55 times.
In reality, 105 patients in the sample have the disease, and 60 patients do not.
True positives (TP): These are cases in which we predicted yes (they have the disease), and they do have the disease.
True negatives (TN): We predicted no, and they don't have the disease.
False positives (FP): We predicted yes, but they don't actually have the disease. (Also known as a "Type I error")
False negatives (FN): We predicted no, but they actually do have the disease. (Also known as a "Type II error")
Real life use cases in Cyber Security
Here we are going to investigate the performance of our classifier in identifying ransomware as a whole. We then move on to discuss how well our classifier can identify a specific type of crypto ransomware.
Data Collection
We collect over 100MB of ransomware traffic traces from malware traffic-analysis.net, resulting in 265 unique bidirectional ransomware related flows. We collect another 100MB of network traffic that is malware free (clean) to use as a baseline. The clean data consists of flows corresponding to web browsing, file streaming, and file downloading.
The false positive rate describes how often clean traffic is misclassified as ransomware. The false positive rate also needs to be as low as possible to prevent the unwarranted blocking of clean traffic. Furthermore, a high false positive rate results in a base rate fallacy issue, which quickly results in a massive number of falsely identified ransomware traffic.
To measure the classifier’s success, we also look at the F1 score.
The F1 score is a weighted average of the recall and precision scores and provides an idea of the balance between the false negative and false positive rates.
Initial Classification Model
We first tune our stream processor to extract 28 unique features
from our collected network traffic. These features are fed into the classifier, which first ensures the data contains the same number of malicious flows as clean flows in order to prevent classification bias.
The data is then split into two, unequal sets. One set consists of
70% of the data and is used for training and the other set holds the remaining 30% of traffic and is used for testing the learned model.
A 810-fold cross validation (CV) is performed on our data splitting to ensure our splitting model is unbiased. The confusion matrix shows the results of our classifier using 28 different
features. Even with a smaller set of traffic data, 200MB, we are
able to achieve a respectable recall of 0.89, a precision of 0.83, and an F1 score of 0.87.
Feature Reduction
Feature reduction is a key method used in machine learning to
increase classification accuracy while simultaneously reducing the
computational cost of the model. In order to reduce the number
of feature in our model, we identify the top eight most influential features in classifying ransomware traffic
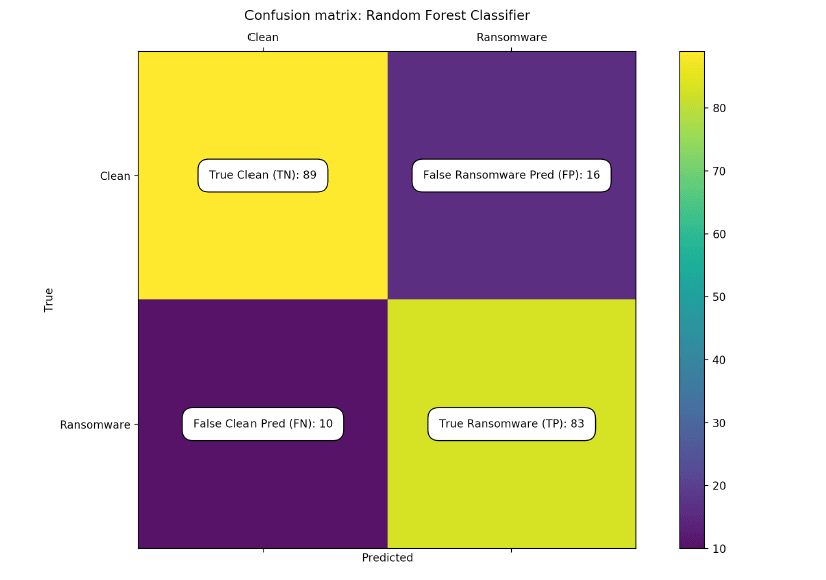
fig 1:The confusion matrix of our 28-feature random
forest classifier shows a recall of 0.89, a precision of 0.83, and
an F1 score of 0.86.

fig 2: The confusion matrix of our 8-feature classifier shows similar results to that of our 28-feature classifier with a recall of 0.87, precision of 0.86, and F1 score of 0.87.
Conclusion
The 8-feature model has a slightly lower recall score at 0.87 but produces a higher precision and F1 scores of 0.86 and 0.87, respectively. However, Figure 1b shows a slightly smaller AUC for the 8-feature ROC indicating that the 8-feature classifier performs about 1.4% worse than the 28-feature model. This slight performance loss will be worth the computational savings when running classification at line rate.

Top comments (0)