After learning on how to deploy an app to Knative on IBM Cloud and how to do Knative log analysis using LogDNA, it’s time to monitor our Knative Kubernetes cluster using IBM Cloud Monitoring with Sysdig service.
IBM Cloud Monitoring with Sysdig is a third-party cloud-native, and container-intelligence management system that you can include as part of your IBM Cloud architecture.
Use it to gain operational visibility into the performance and health of your applications, services, and platforms. It offers administrators, DevOps teams and developers full stack telemetry with advanced features to monitor and troubleshoot, define alerts, and design custom dashboards. IBM Cloud Monitoring with Sysdig is operated by Sysdig in partnership with IBM.
Provision a Sysdig instance
Before provisioning the service, Manage user access
With your Knative node app running on IBM Cloud, let’s provision a Sysdig instance to start monitoring the app.
- Navigate to the observability dashboard and under overview > click “create monitoring instance”.
- Give a service name, choose a region/location (us-south), select a resource group and choose an appropriate plan based on your requirement.
- Click create to provision the instance.
Configure the Sysdig agent
After you provision an instance, you must configure a Sysdig agent for each metric source that you want to monitor. A metric source is a cloud resource that you want to monitor and control its performance and health. In our case, the metric source is a Kubernetes cluster.

To configure,
- Under monitoring on observability dashboard, click on Edit sources next to the Sysdig instance you just created in the above step.
- Click Kubernetes on the left pane and as you have already set the KUBECONFIG, you can skip to “Install Sysdig agent to your cluster” step.
- Run the command which looks something similar to this (with your sysdig access key)
curl -sL https://raw.githubusercontent.com/draios/sysdig-cloud-scripts/master/agent_deploy/IBMCloud-Kubernetes-Service/install-agent-k8s.sh | bash -s -- -a **<ACCESS_KEY>** -c ingest.us-south.monitoring.cloud.ibm.com -ac 'sysdig_capture_enabled: false'
Alternatively, you may deploy the Sysdig agent manually by following the instructions here.

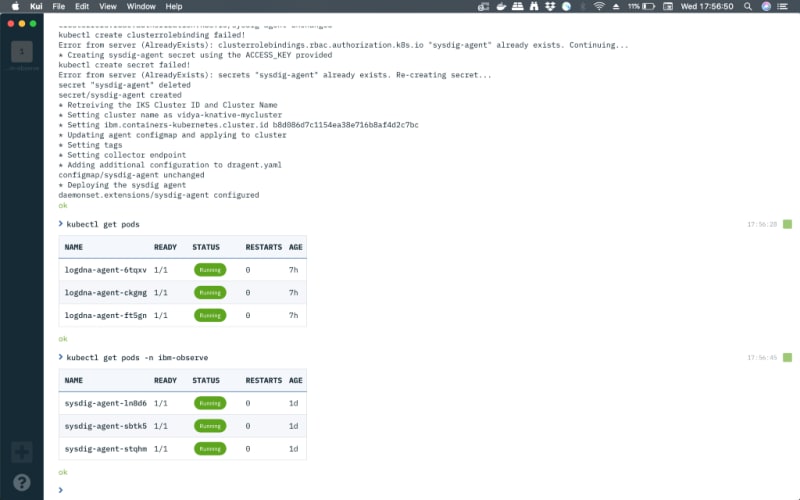
- To confirm the successful creation of Sysdig agent on every worker node in the cluster, run the below command
kubectl get pods -n ibm-observe
Monitor your cluster
Let’s monitor our Kubernetes cluster running your app on Knative.To do this, click View Sysdig and you should see the sysdig monitor wizard.
- On the welcome page, click Next.
- Choose Kubernetes as your installation method under set up environment.

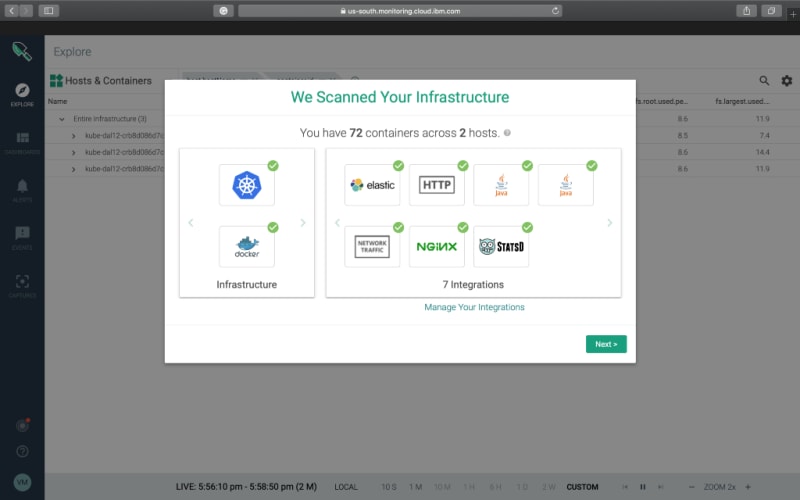
- Once your nodes are connected, you are ready to go. Your cluster will be scanned for Infrastructure and integrations.
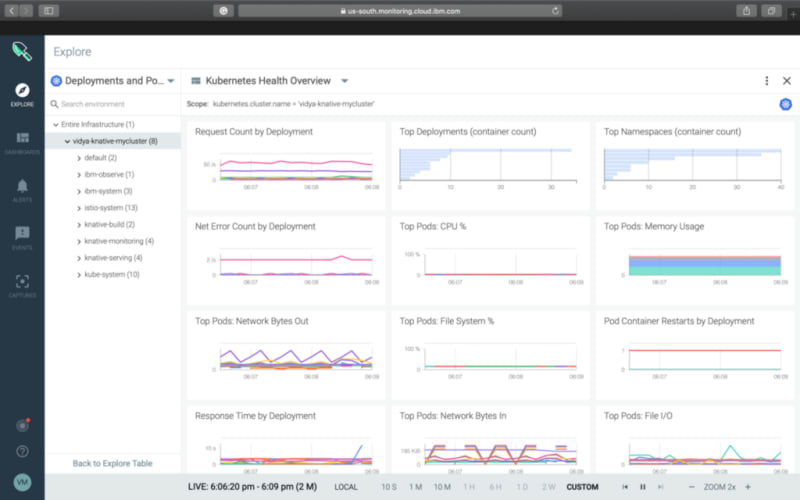
- You can monitor your cluster in the EXPLORE view that is available through the Web UI. This view is the starting point to troubleshoot and monitor your infrastructure. It is the default homepage of the Web UI for users.
- On the EXPLORE view, You can see all the namespaces in your cluster and check various dashboards and metrics with a bundle of information including the Health of your nodes, deployments, pods, services etc.,

- We need to generate some traffic/load and there are many open source libraries/tools available. In the post, we will be using Vegeta, an HTTP load testing tool and library. You can also use hey.
- Before generating the load, let’s quickly check whether the IP_ADDRESS and HOST_URL are set properly while deploying the app.
echo $IP_ADDRESS

echo $HOST_URL
After installing Vegeta, run the below command
echo “GET [http://${IP_ADDRESS](http://%24%7BIP_ADDRESS)}" | vegeta attack -duration=300s -header “Host: ${HOST_URL}” | tee results.bin | vegeta report
vegeta report -type=json results.bin > metrics.json
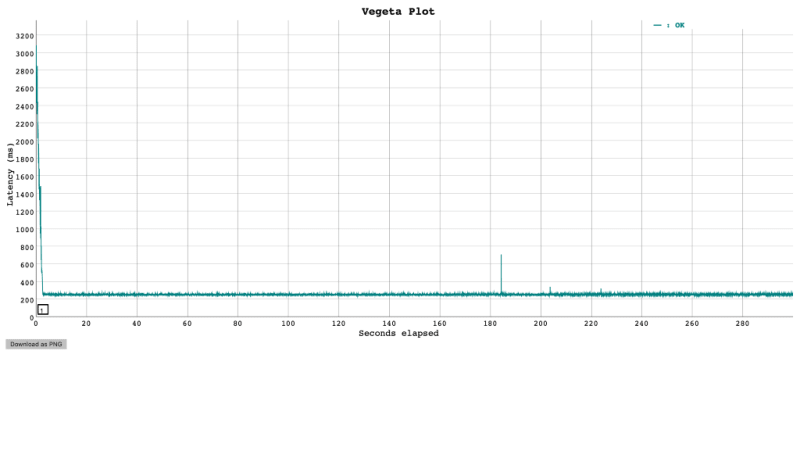
cat results.bin | vegeta plot > plot.html
cat results.bin | vegeta report -type=”hist[0,100ms,200ms,300ms]”
You can open the plot.html file in the folder you have run the above command to see the Vegeta plot
Once you start sending a load of HTTP requests, it’s time to check the dashboards.
Use dashboards to monitor your infrastructure, applications, and services. You can use pre-defined dashboards. You can also create custom dashboards through the Web UI or programmatically. You can backup and restore dashboards by using Python scripts.
A dashboard shows groups of metrics that report on the health, performance, and state of your infrastructure, applications, and services for a single host or a group of hosts. Dashboards offer a specialized insight into network data, application data, topology, services, hosts, and containers.
- Click DASHBOARDS on the left pane and select HTTP overview under My Shared Dashboards. You should see the Request Count and other metrics.
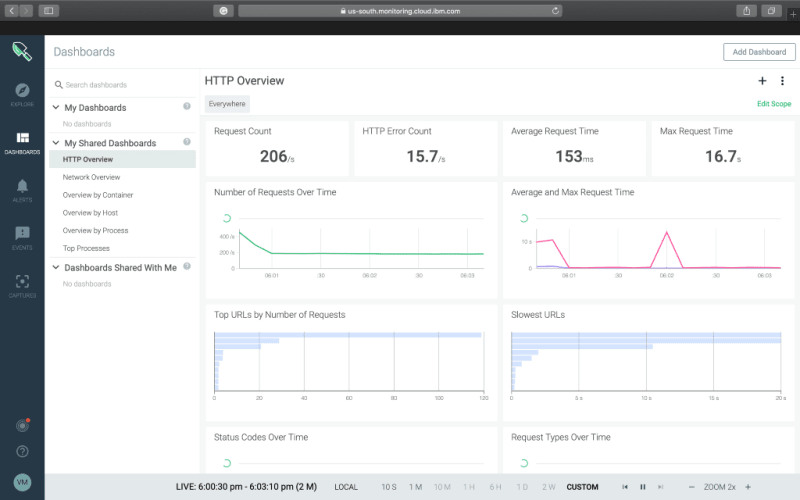
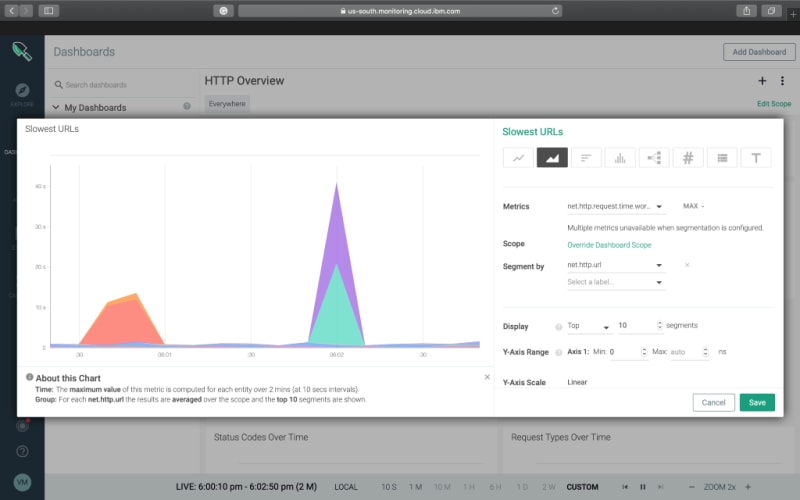
- Feel free to change the way you want to see….
- Here’s an overview by Container

What we have seen is just the tip of an iceberg, To dig deeper into dashboards, read this
You can also learn about alerts. For more information, see Working with alerts.
Autoscaling in action
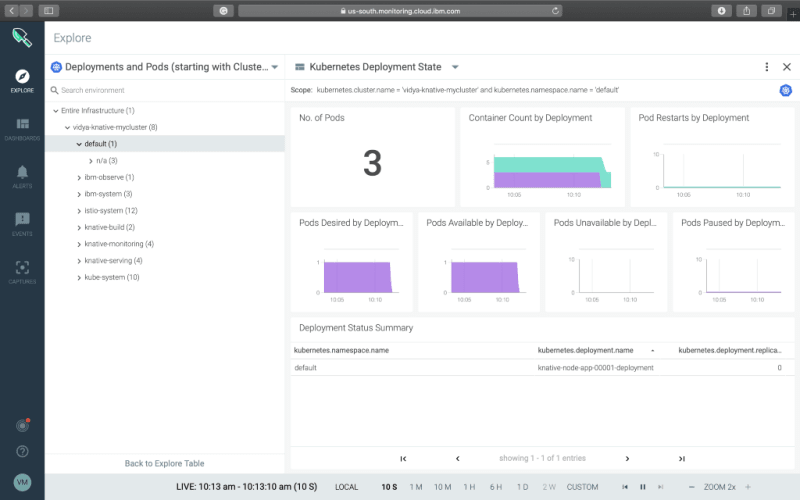
Let’s check the autoscaling feature of Knative in a Sysdig dashboard real-time. Before making a Vegeta attack, this is the deployment state of Kubernetes default namespace. If you observe closely there’s no knative-node-app pods.
No. of Pods = 3 are logdna pods.
Don’t forget to set on the refresh time to 10 S on the LIVE panel in the bottom of the page.
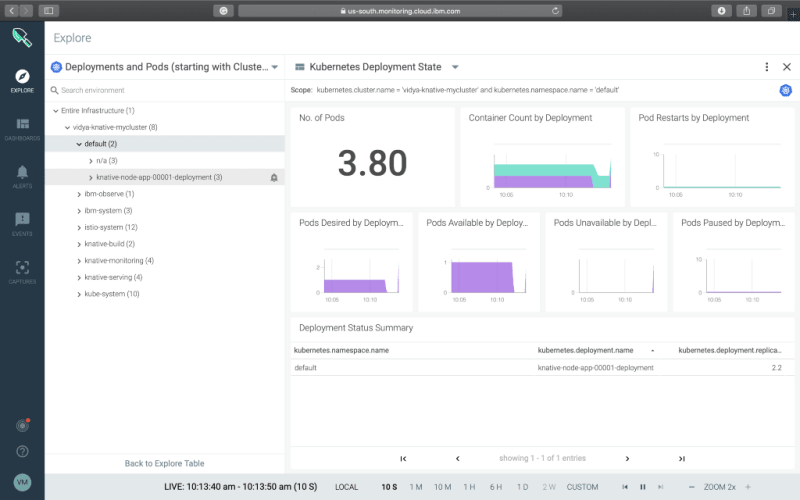
Once we make a Vegeta attack say for 60 seconds, this is what you will see, a new knative-node-app-00001-deployment scaled to 3 pods to take the concurrent requests. After the load goes down, it will return to the
Questions or concerns? Please don’t hesitate to reach out to me on Twitter: VidyasagarMSC
Further reading
- Knative Docs
- Knative Monitoring

Top comments (0)