Hey there, Dev.to community!
We are working on a free data visualization tool for developers and want to share it with you!
We do hope you’ll find it useful for your project.
Let me introduce the product in a few words.
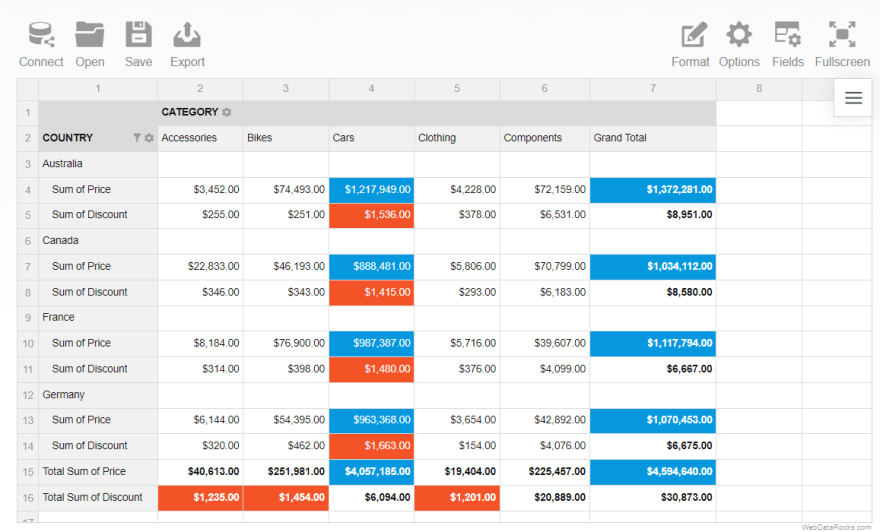
WebDataRocks Pivot Table is an embeddable, rich-featured JavaScript library for visualizing data and it’s analysis. You can customize it to your report logic and app’s UI.
Who this library is for
It’s a real find for everyone who needs to enrich a website or application with analytics for internal or external purposes.
What makes it special
The component is a web-based, meaning you can slice & dice your data right in the browser.
We made the tool lightweight and performant.
It’s handy for developers to embed and integrate with any frameworks and third-party libraries.
Anyone familiar with Excel will easily get used to the functionality of WebDataRocks. Since we endeavored to create a highly intuitive interface for end-users, those who have not used Excel Pivot Tables before will be able to start reporting just as fast.
Last but not least - it’s Free.
Reporting features highlights
- Connecting to CSV and JSON data sources
- The drag-and-drop feature for dynamic report composing
- 17 aggregation functions, multiple filters, and layout options
- Exporting to PDF, Excel, and HTML
We've prepared a visual overview of all the core reporting features on YouTube to show you how to create your first report ✏️📝
What’s new
Here’s the list of awesome features that come with the latest updates:
- Auto-calculation bar - check intermediate calculations real-time by selecting multiple cells on the grid
- More connection options via UI
- TypeScript type definitions for easy integration with TypeScript apps
- Vue integration
- React + TypeScript integration
And more!
Dive into all the release features on our blog📚
Demos
Play with the demo to get a feel of what you can do with the component.
On our CodePen, you can embrace the full variety of results you can achieve with WebDataRocks. Take a minute to check it. We hope you’ll love it!
And one more thing…
We’re live on Product Hunt today!🥰
https://www.producthunt.com/posts/webdatarocks-pivot-table
Please check out the tool and share your fair feedback about it. It would mean the world to us!


Top comments (1)
Hi dev community!
I'm Mykhailo, a technical specialist at WebDataRocks.
Let me explain to you how to start working with the tool.
After configuring the tool on the web page, all you need to do is to load your raw CSV or JSON data into the component. Next, compose your first report in a drag-and-drop manner.
All the features for transforming data into insights are available through the intuitive user interface. To get acquainted with all of them, check out our detailed UI guide.