It took me a long time to figure out which area of software development I like. So I've tried a bunch of different technologies, and many different tools that accompany them. I've spent three years coding with Vim, wrote a whole project using Netbeans, and gradually tried every popular text editor for web development out there, including VSCode.
Seeing VSCode getting so much attention, with people like Kenneth Reitz recommending it for Python development, I thought it would be refreshing to talk about completely different development setup.
I discovered some PyCharm features after I saw them used in other editors. With this post, I hope to do the same for you: encourage you to explore your editor more thoroughly, getting the most out of it.
Recognizing the strengths
There is a couple of things IDEs do best, so I tried to center my workflow around them:
- Navigating the codebase.
- Integrating everything in one place.
What follows is the list of features I use almost every day. I also give links to appropriate documentation pages. If there's a keyboard shortcut, I will indicate it in brackets (having in mind Apple keyboard layout).
Navigating the codebase
Common-sense features
A common thing to have among the editors is "find everything". In PyCharm, it's ⇧⇧ shortcut.
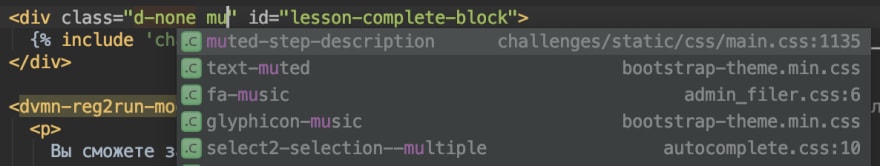
"Jump to declaration" (⌘B) would not surprise anyone, too. In PyCharm it works in many different contexts, with no configuration whatsoever. So if I wanted to find SCSS class declaration, I would press ⌘B and get

Same shortcut for JS symbols, Django Template Language, and simply opening an included file. And if I use ⌘B on the declaration itself, it will show the usages.
To find a string, I use global search (⌘⇧F). The nice thing about it is that it allows me to search in the source code of the project dependencies, even if they are located in a different folder.
The "take me back" button (⌥⌘←) comes in handy when I found what I was looking for.
There's also multi-cursor with different editing shortcuts that I like, but I'll avoid reciting the manual. Everybody has these features anyway.
Things I didn't know I needed
Ubiquitous and reliable hints is something I always miss when I'm using a simple text editor.
I don't have to google the bootstrap classes anymore! It also hints me the names of the attributes I override, a thing I tend to do all the time while working with Django.
The hints are also useful for imports. But I don't use them for that, because PyCharm has built-in auto import.
Vim bindings is something I wanted from every editor I tried. This is not the case with PyCharm with its select-nearest-block-that-makes-sense feature (⌥↑):
Finally, the bonus for non-native English speakers such as myself: the spellcheck. In one of my projects, we had two classes: Enhancement and EnchancementTemplate. My teammate made a typo in the second name, and it would have remained unnoticed if PyCharm didn't underline Enchancement during the code review.
Integrating everything in one place
Deployment
I don't fully remember how to deploy the project I'm working on.
All I know is that clicking the green "start" button at the corner will do all the necessary work for me. It will even reload the server once I change the source code.
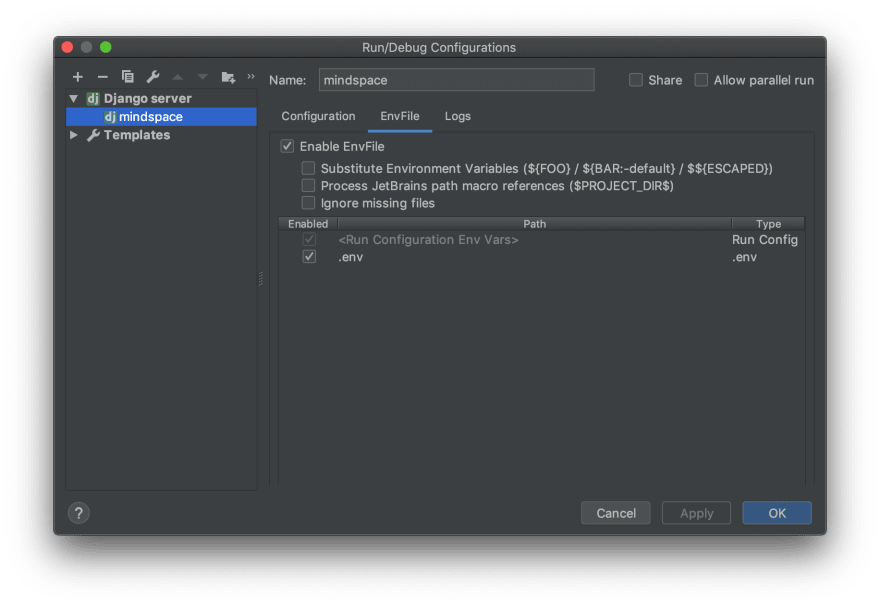
This is enabled by the thing PyCharm calls Configurations. In Django project, all this thing asks for is environment variables. But it allows me to do much more than that.
In my project, Django runs on its own, but Redis and Postgres run in their own containers. So I made my Django configuration run docker-compose up -d each time I start the project. This way, I lifted the mental toll of having to remember this detail.
Debugging
Once I configured how I run the project, I got the debugger configuration for free. The only difference is that I click on the green bug instead of the green triangle.
In order to insert a breakpoint, I don't need to insert any code. I click on the line I want my breakpoint to be on, and trigger the target code. No more forgetting to remove import pdb; pdb.set_trace() for me!
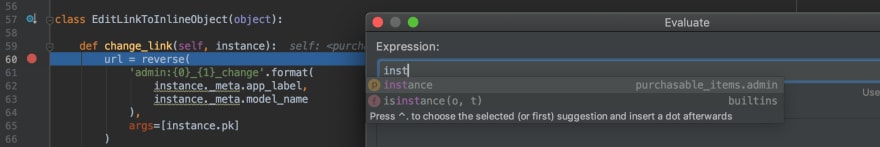
When I hit the breakpoint, I click "Evaluate Expression" (the little calculator icon) and here I have the same interactive shell I had in pdb with an addition of hints and autocomplete.
I love that debugger behaves nicely even if two or more requests come in and trigger the same breakpoint several times. With pdb, this situation was a nightmare.
VCS and task tracking
When I first started using PyCharm, I did all my version control from the terminal. To make things comfy, I used a lot of git aliases. Then I dug a little deeper into how PyCharm handles the VCS and liked it.
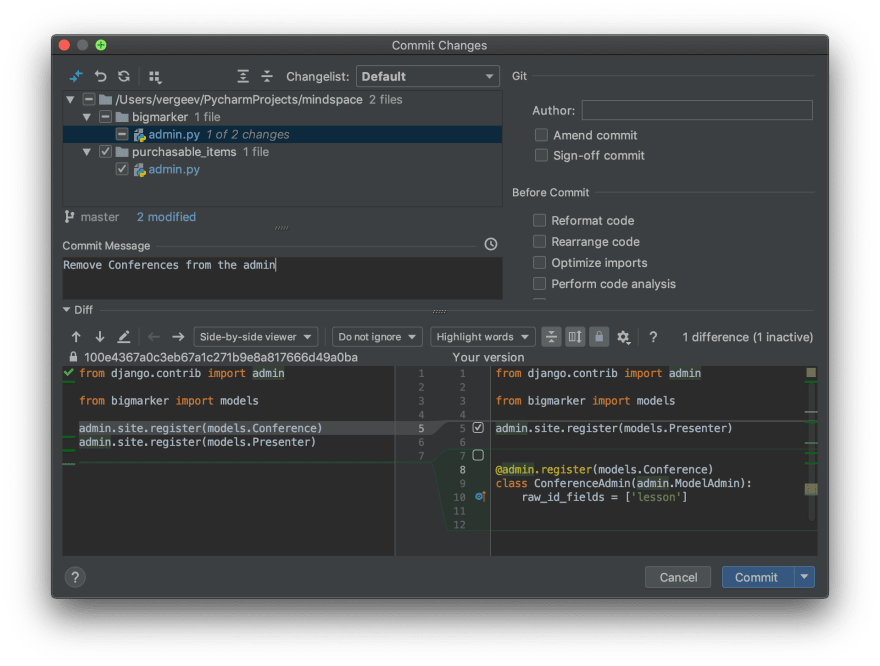
I don't need to remember the details of how VCS is handled. Any time I have something to commit, I press ⌘K, deselect the things I don't want to commit yet, and write the commit message. As someone who's obsessed with git add --patch and atomic commits, I find it wonderful that I can visually select the changes I'm going to commit.
Now that PyCharm knows when I commit, it would be nice if it could track the ticket I'm commiting for, right? And this can be done: I connected the corporate Gitlab server with Tools | Tasks & Contexts | Configure Servers and PyCharm fetched the tickets. Now I have different sets of tabs and changes open for each task, and can switch to a new task more easily. I can even measure the time I spent working in each context and send it to my issue tracker.
Sometimes I forget to commit often and end up losing important changes. Local History allows me to roll them back and already saved me hours of repetitive work.
Terminal
Two great things about it:
It remembers the opened tabs and history for each of them.
So one of my tabs is always opened in case I need SSH Port Forwarding, and in the other I dofab deployto deploy the code to production.Virtual Environment is activated automatically, so
pip installworks exactly as I expect.
The glaring problem with it is inability for the terminal to share environment with Configurations without copy-paste, so python manage.py makemigrations might end up doing migrations for the wrong database. I show how to ameliorate the problem in the next section.
Python Console
It's nice to be able to run arbitrary code inside the Django project. The problem is that I have to remember to set the correct environment for python manage.py shell. And again, I want my hints and autocomplete.
To achieve that, I install a couple of external things:
I tell my configurations to load variables from the .env file, like so:
Then I go Preferences | Build, Execution, Deployment | Console | Django Console and in the Starting script area write
import sys; print('Python %s on %s' % (sys.version, sys.platform))
import django; print('Django %s' % django.get_version())
sys.path.extend([WORKING_DIR_AND_PYTHON_PATHS])

# this will allow to load the correct environment for the shell
from dotenv import load_dotenv
from pathlib import Path
load_dotenv(dotenv_path='.env')

# this is needed if the project uses django-configurations package
# import configurations
# configurations.setup()

if 'setup' in dir(django): django.setup()
import django_manage_shell; django_manage_shell.run(PROJECT_ROOT)

# and this will allow to call any "python manage.py ..." command from the shell
from django.core.management import call_command
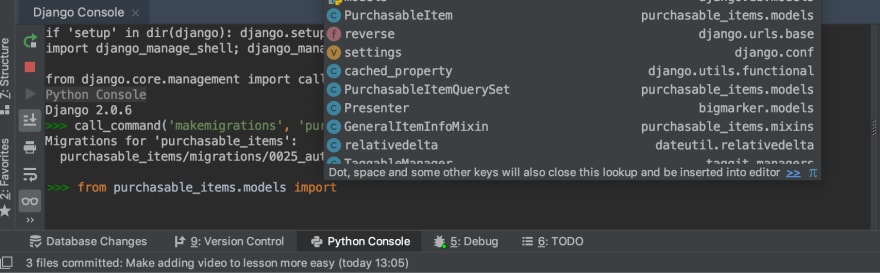
Now I can open Python Console to run migrations and freely interact with Django models while getting autocomplete and the default IDE shortcuts.
In this very shell I can even interact with the data on the remote database. To do that, I forward the remote database to my local host (see how remote port forwarding works):
ssh -L 5431:127.0.0.1:5432 user@example.org
And then I tell Django that the production database is located at 127.0.0.1:5432 using Django's support for multiple databases.
Now the following code in the Python Console will get me the number of users on the production database:
User.objects.using('production').count()
Jupyter Notebook
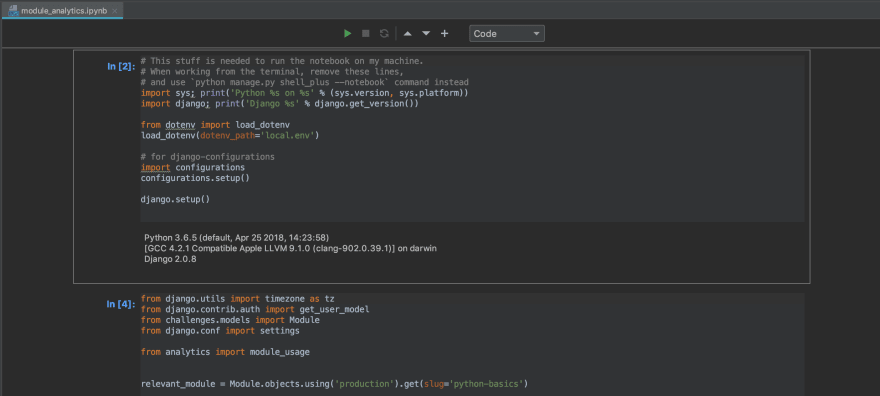
Integration of Jupyter Notebook with Django is similar to integrating Python Console. Open the .ipynb in PyCharm. As the first cell, run
import sys; print('Python %s on %s' % (sys.version, sys.platform))
import django; print('Django %s' % django.get_version())
sys.path.extend([WORKING_DIR_AND_PYTHON_PATHS])

# this will allow to load the correct environment for the shell
from dotenv import load_dotenv
from pathlib import Path
load_dotenv(dotenv_path='.env')

# this is needed if the project uses django-configurations package
# import configurations
# configurations.setup()

django.setup()
and you have the Django-Jupyter-PyCharm toolchain ready to go.
Using port forwarding trick described above, you can even do the computations on the production data.
Database
If you didn't like the idea of local code messing with production data, you can connect to the database using a dedicated tool.
It was of great help when the ORM was not available. And again, autocomplete and database inspection made life so much easier.
This thing is also well-documented.
Sass
In order to get Sass/SCSS files compile automatically, I had to set up file watchers.
For my project, the default settings were OK, but generally file watchers ask you to provide the path where you want to put the compiled files.
Scratches
I'm writing this post in PyCharm. I use a scratch file, and the process looks like this:

Alongside the scratch file, I have the example project opened.
I use scratch files primarily while I'm designing some complex features.
Scratch files are also easily exported to Github Gist: 
Updating PyCharm
Until recently, I used to update PyCharm by downloading a new version manually from the website and replacing the binary.
Ready to explore?
I came up with the workflow I currently have because other people shared how they do stuff. I got familiar with the idea of the one-step build thanks to Makefile. I found integrated debugger in PyCharm after I read about that exact feature for VSCode. I decided I needed comfortable Python shell when I saw my friend using IPython.
This is why I wrote this post: so you could discover new features you like and integrate them into your workflow.
I don't want to stop with what I have. Let me know how you prefer to get things done, I probably have a lot to learn.
Also
- The Law of Leaky Abstractions — why you shouldn't use an IDE if you only starting out.
- Vim Is The Perfect IDE — while I am avoiding CLI as much as possible, this post offers the opposite approach.
- Curse of the IDE — problems with IDEs you should be aware of.
- Master your IDE — a short post with direct instructions.

Top comments (1)
Awesome article actually there's actually a feature in Pycharm.
Where you press "ctrl+left click" to functions or methods. It jumps to functions or methods you had declared that is being used.
It really saves you alot of time to hunt down the function or methods in different python files.