MIHTool - iOS Web Debugger Pro
MIHTool helps Front-End Engineers to debug and optimize their webpages on iPad and iPhone
- Action Extension for Safari, brings remote Web Inspector to debug your webpages in Safari. A Inline Web Inspector that is a real Chrome like DevTool for iPad Safari. Learn More…
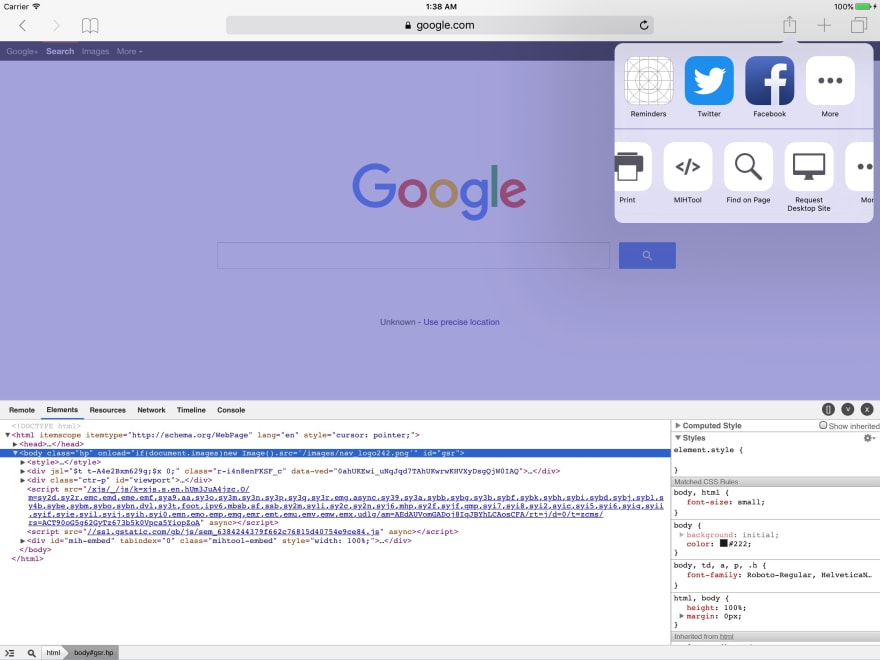
MIHToo Action Extension for Safari is the first App that brings a real Chrome like Inline DevTool for iPad Safari. Now, you can inspector your web pages in iOS Safari and Safari View Controller right on your iPad without a desktop computer. You can also remote Web Inspector to debug your webpages in Safari and Safari View Controller.
To open MIHToo Action Extension, just click the Share Button of Safari and select MIHTool, for the first time, you might have to enable it in the more list.
Just like Chrome DevTools, it has Elements,Resources,Network,Timeline and Console panel. And it totaly optimized for touch screen. You can maximize and minimize.
Note: If you can’t see any logs in Network or Timeline panel, be sure the record circle switcher is RED.
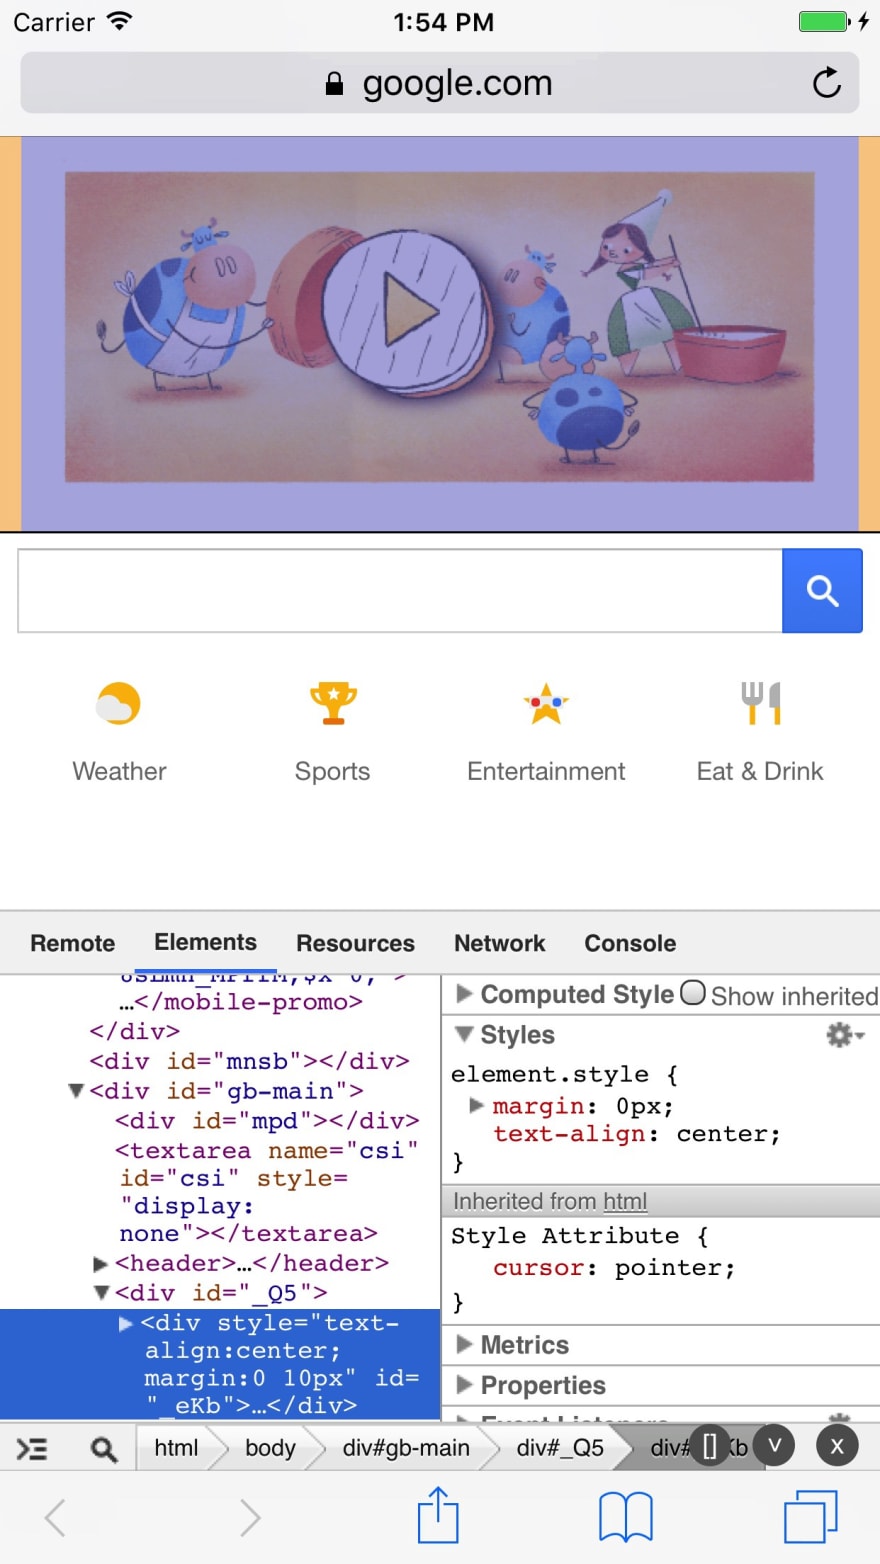
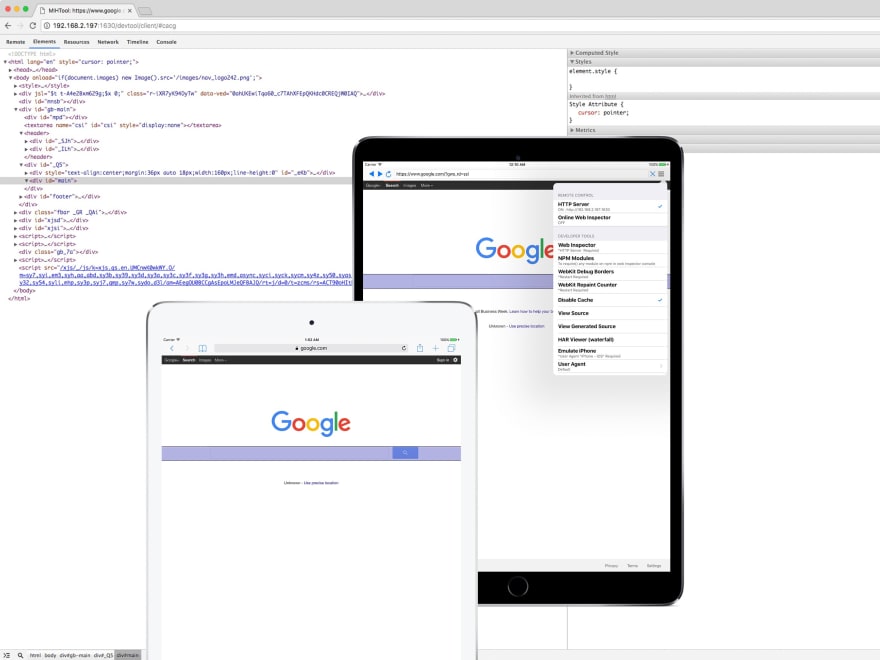
2.Inline Web inspector(like Chrome DevTool or FireBug):With Elements,Resources,Network,Timeline,Console panel. Learn More…
Inline Web inspector is an iPad only feature.Which makes you possible to inspector your webpages right on your iPad without a desktop computer.
Just like Chrome DevTools,it has Elements,Resources,Network,Timeline and Console panel.And it totaly optimized for touch screen. You can maximize,minimize,zoom-in and zoom-out.
Note: If you can’t see any logs in Network or Timeline panel,be sure the record circle switcher is RED.
Please check this video to see how it works.
Web inspector is based on weinre,bug reports please check weinre google group.
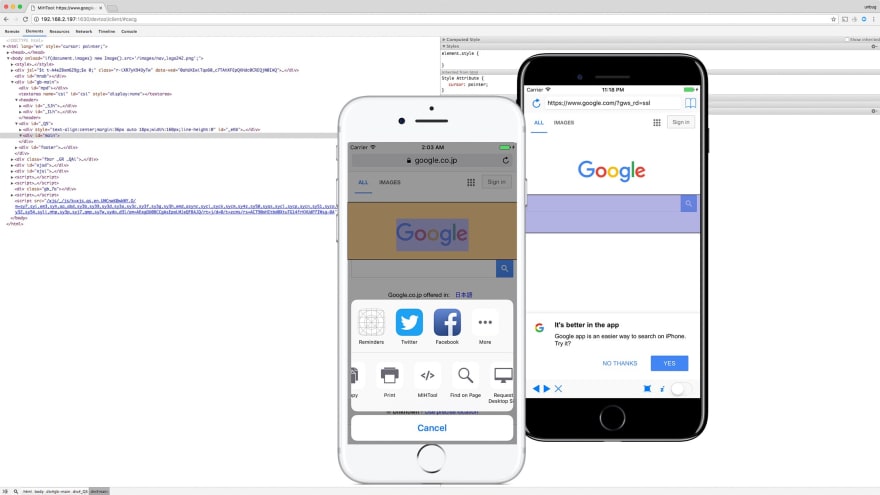
3.Web inspector remote(weinre):remote to debug and optimize your mobile webpages on your computer(window,mac,linux with chrome). Learn More…
Web inspector remote makes you possible to inspector your webpages with any remote computer(window,mac,linux,or another iPad) in the same local network.
Just like Chrome DevTools,it has Elements,Resources,Network,Timeline and Console panel.
Note: If you can’t see any logs in Network or Timeline panel,be sure the record circle switcher is RED.
Web inspector is based on weinre,bug reports please check weinre google group.
4.Online Web Inspector. Learn More…
Online web inspector just works as web inspector remote.But is allows you to inspector your webpages with any online remote computer even they are not in the same local network.
Some time your devices are in the local network but may not be accessed by each other,so web inspector remote won’t work for you,but if your devices can access external network,online web inspector will work just fine.
5.HTML editor:view webpage source code with syntax highlighting and formatting;editing source code or creare a new webpage and preview the result. Learn More…
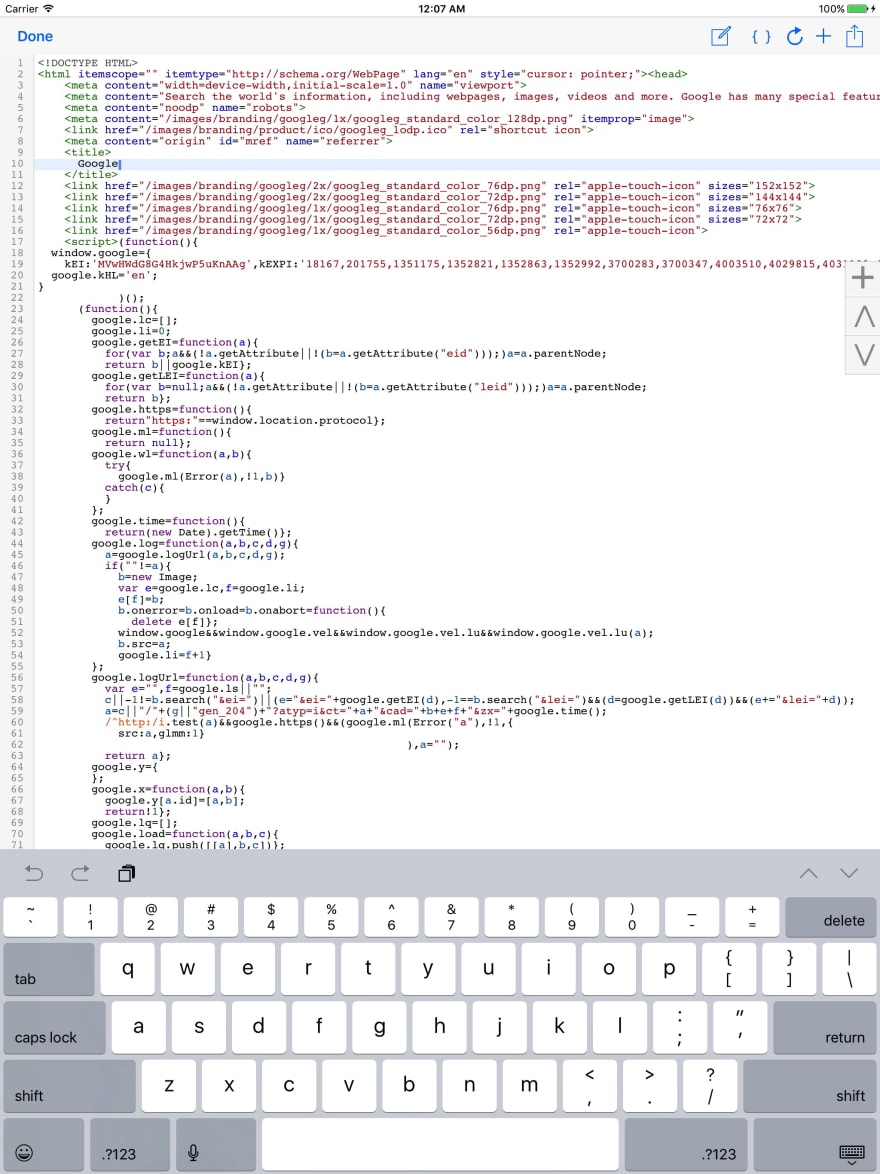
HTML editor is an iPad only feature.Which makes you possible to view and edit any webpages source code with syntax highlighting right on your iPad.
Sure you can create a new webpage with HTML editor and view the result,you also can format source codes or just share them with your friends.
It totaly optimized for touch screen.And you can remote control to export current webpage’s source code.
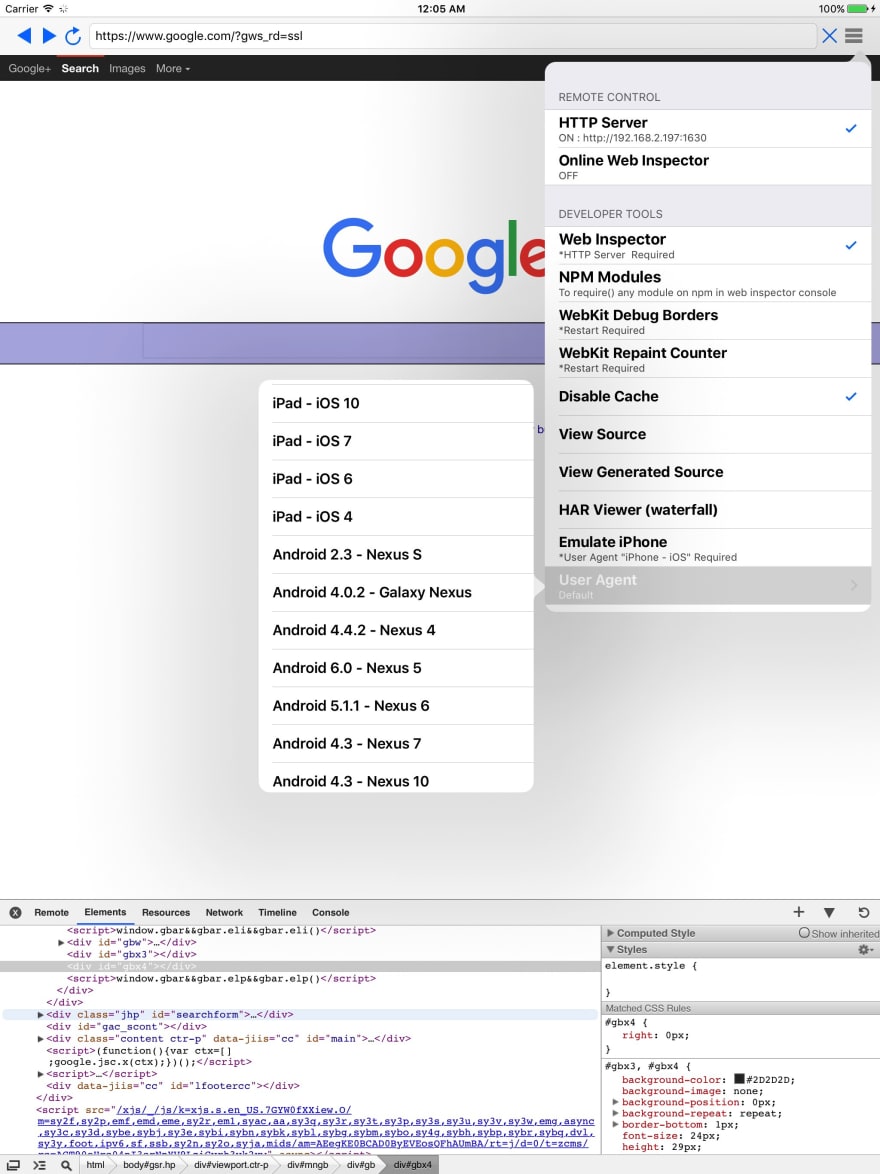
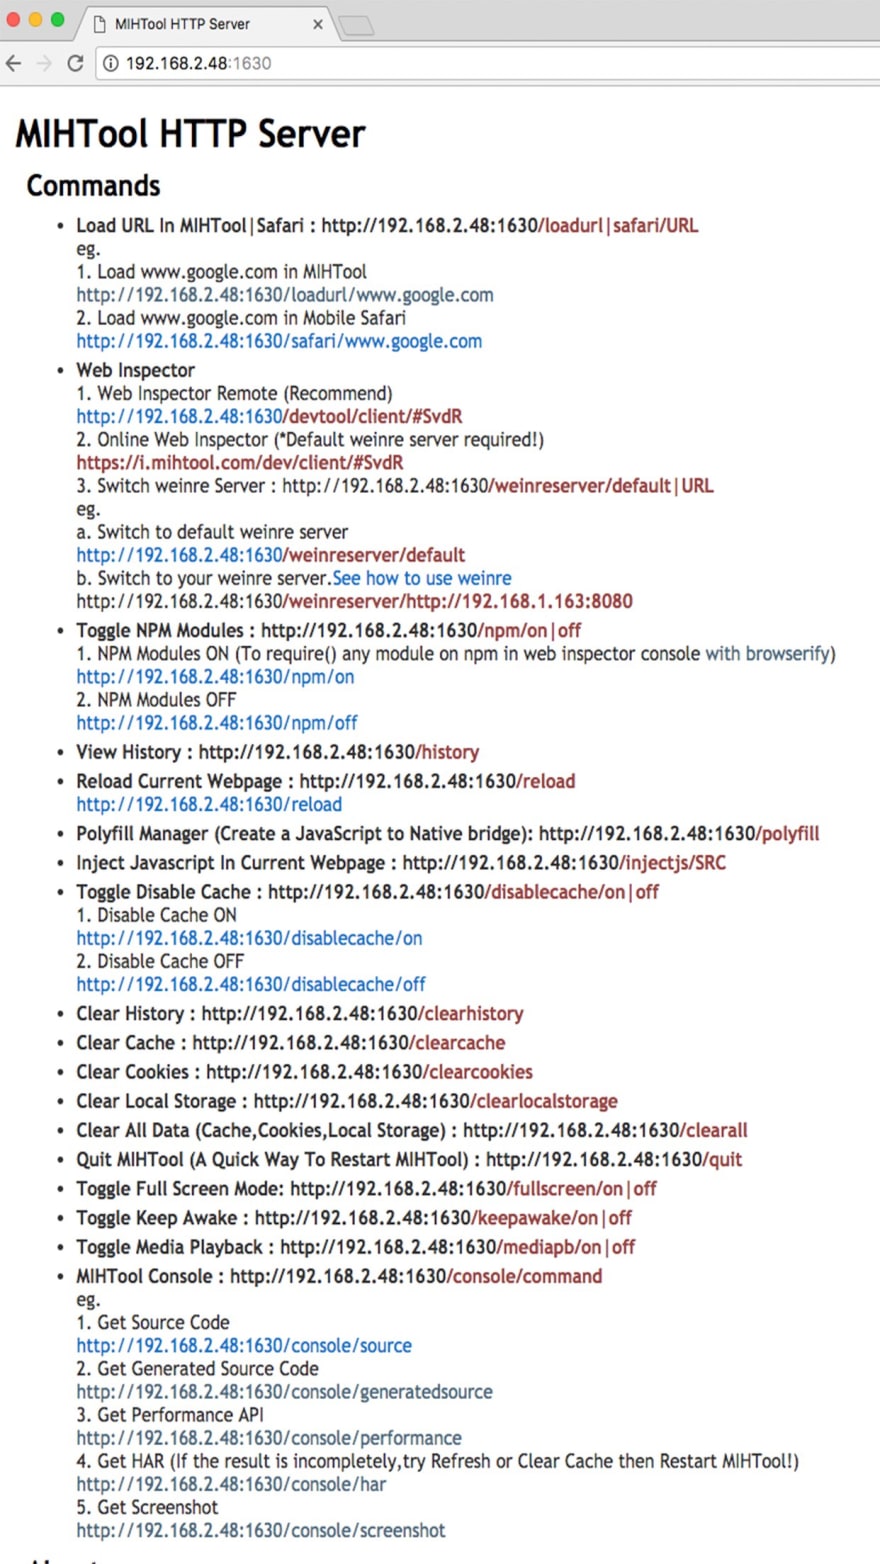
6.Remote control(With HTTP Server):Remote to,Load URL in MIHTool|Safari|Chrome;Inject Javascript in current webpage;Clear website data;Get HAR data;Get source code;Get screenshots… Learn More…
Turn ON MIHTool’s HTTP Server you will get a HTTP link like [http://192.168.1.101:1630,th](http://192.168.1.101:1630,this)is link allows you to be able to remote control MIHTool from any remote computer(window,mac,linux,or another iPad) in the same local network.
Open the HTTP link from a remote computer,you will see many commands are available for you.
Almost each feature of MIHTool can be remote control with it’s command,such as Load URL in MIHTool|Safari|Chrome;Web Inspector;Inject Javascript in current webpage;View history;Clear website data;Get HAR data;Get source code;Get screenshots,and so on.
All remote commands are REST like so you can write some auto-run scripts to automatically test your wepages.This is very conveniently for you to control multi devices form a single computer at the same time.
7.Show WebKit Debug Borders(Compositing Render Layers). Learn More…
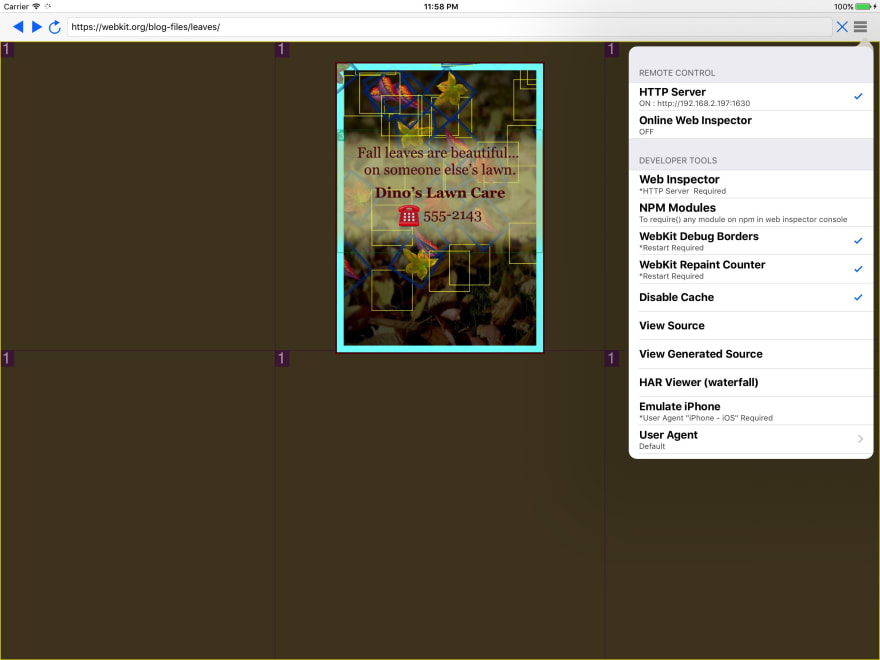
Show WebKit Debug Borders(Compositing Render Layers) and Show Webkit Repaint Counter(Paint Rects) is a way for you to optimize your web apps and make them 60FPS performance.
To learn how to optimize web apps please check
8.Show Webkit Repaint Counter(Paint Rects). Learn More…
9.Emulate iPhone. Learn More…
Emulate iPhone is an iPad only feature.Which makes you possible to see how your webpages look like on iPhone without an iPhone.
10.User agent switcher. Learn More…
User agent switcher is an iPad only feature.Which makes you possible to switch other platform’s broswer user agent,such as android,pc,and mac.
11.More developer bookmarklets:Firebug,YSlow,JS Console,PageSpeed,GTmetrix…
12.Evaluating JavaScript in the address bar.
13.Full screen mode(Shake Device To Toggle Full Screen Mode).
14.Disable cache.
15.Clear history,clear cache,clear cookies, clear local storage.
16.Keep awake(Default is ON).
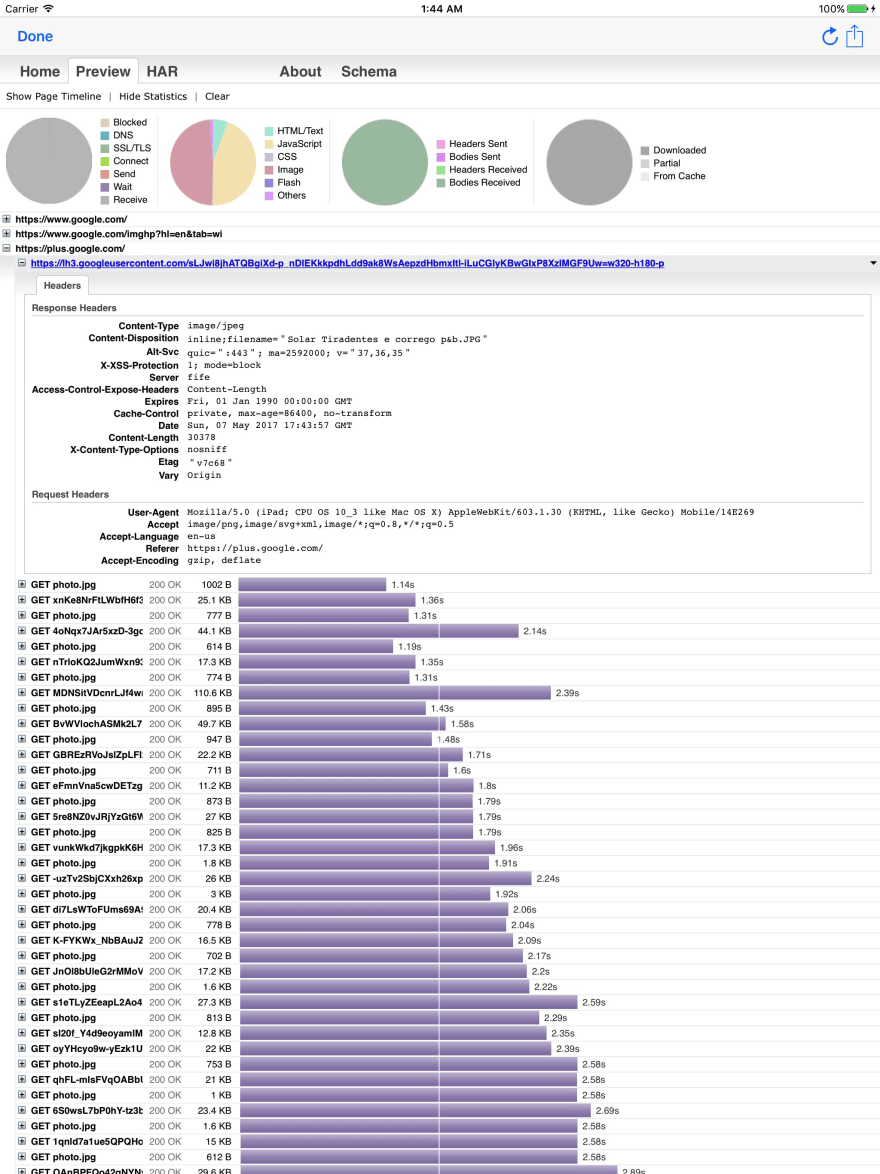
17.HAR Viewer.(Also see logproxy) Learn More…
With HAR Viewer you can see your webpages network traffic waterfall and export the HAR data for more advanced research.
HAR Viewer is iPad only,for iPhone you can use remote control to export HAR data and view in Online HAR Viewer(Be sure the “Validate data before processing?” box is un-checked .)
18.Performance API. Learn More…
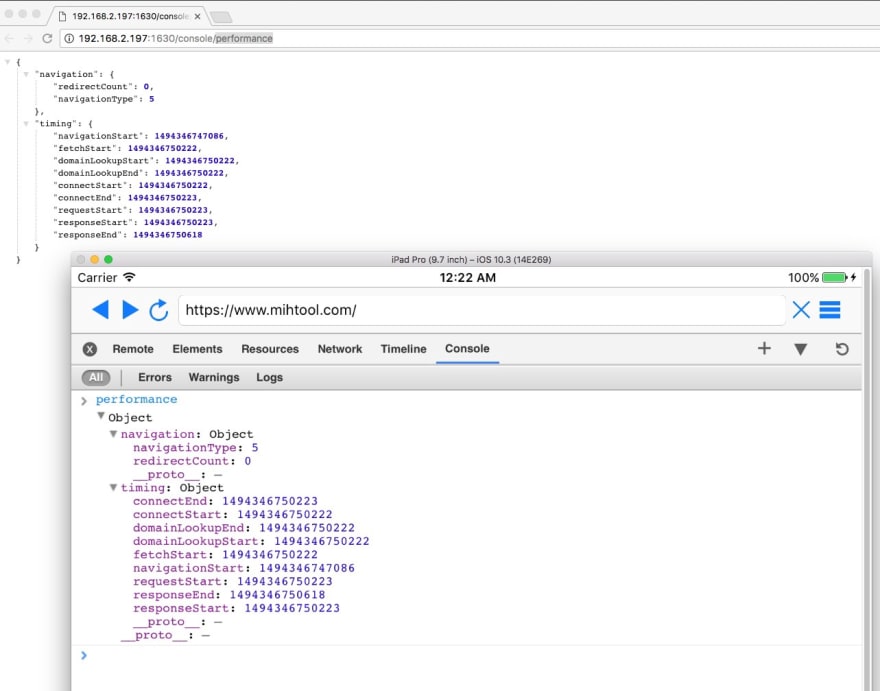
An implements of Performance API
The Performance interface represents timing related performance information for the given page.
19.Polyfill Manager(simulate APIs for javaScript to Objective-C communication,demo) Learn More…
You might build webpages for hybird apps,and your webpages need to communicate to the native app.You can use Polyfill Manager to simulate native app’s APIs,so you can debug you webpages before the native app finished,even the native app has not been installed on your device.
Please check this video to see how it works.
20.NPM Modules (To require() any module on npm in web inspector console with browserify)Learn More…
To require() any module on npm in web inspector console with browserify
Browsers don’t have the require method defined, but Node.js does. With Browserify you can write code that uses require in the same way that you would use it in Node.
This feature makes MIHTool more powerful and easier for you to debug and optimize your webpages.
What font-end masters say about MIHTool:
MIHTool is a brilliant tool that helps you debug websites on iOS. — @pbakaus (Google).
MIHTool will change your life: A complete inline Web Inspector on iOS with performance profiling. — @addyosmani (Google).
MIHTool: a smart & powerful debug tool for iOS WebView. — @paul_irish (Google).
MIHTool: a good tool for debugging websites on iPad and iPhone. — @smashingmag (Smashing Magazine).
Articles about MIHTool:
Paul Bakaus (Open Web Developer Advocate at Google) : MIHTool, the iOS web debugger
GoogleDevelopers : Mobile Web Thursday : Dev Tools
Google I/O 2013 : The Modern Workflow for Developing the Mobile Web (By Matt Gaunt), Slide
Frontrend in Tokyo : Mobile Web Development Workflow (by Addy Osmani)
Jan Polzer: Jak na to — vzdálené ladění webu na iPadu pomocí MIHTool
Tribo do C.I.Podcast : MIHTOOL: FAÇA OS SEUS APLICATIVOS WEB PARA IOS ACONTECER
Yuka : MIHTool: iOS web debugger
unbug : 与大家分享 MIHTool 的开发心得
InfoQ : iOS Web 开发调试工具 MIHTool 作者访谈


Top comments (0)