
Hello, I would like to show you how easy it is to create a User defined Grafana Alert. In this example I will use a simple PromQl to retrieve the current RAM allocation of a specific Job and evaluate it against a specific set of conditions for example I would like to know when the specific Job has allocated more than "X" GB of Ram or if these specific Job has stopped.
So, Lets Dive in...
You can access the Official Documentation which include a really helpful video to help you get started.
Actual Steps:
Step 1: Access Alerting Section by clicking Alert Icon is located in the Sidebar Section.
Step 2: Create a new Alert Rule as you can see from the following screenshot

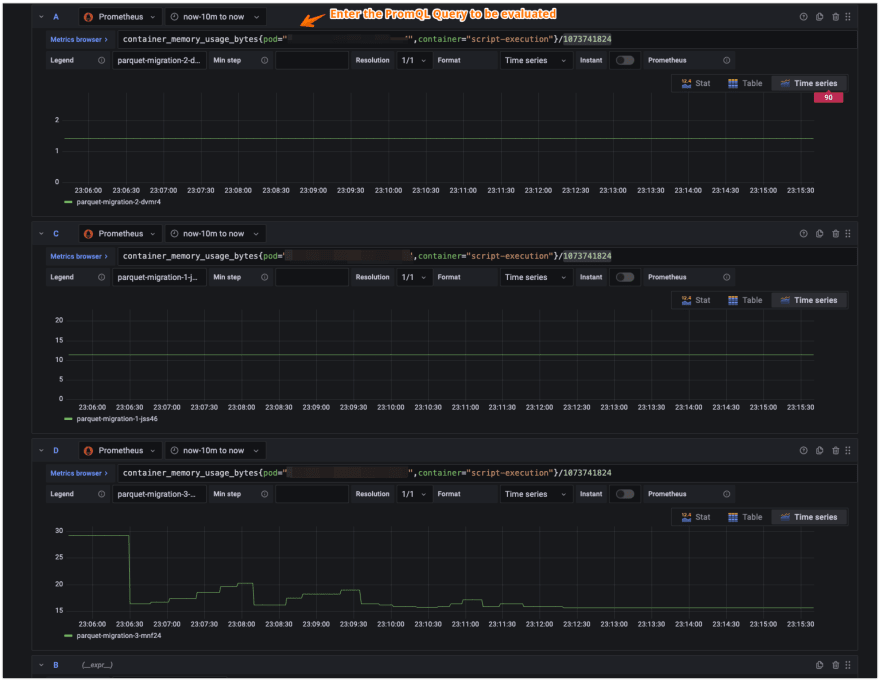
Step 3: Select Prometheus as the preferred data source in the field metric paste the PromQL Query: container_memory_usage_bytes{pod="",container=""}/1073741824 # Convert to GB
Step 4: Specify the conditions you want trigger the alert when the evaluation of the conditions are violating the defined threshold.

Step 5: Specify the interval of the evaluation and the time Grafana needs to wait after an alert has breached the defined threshold.

Finally click the button Save and Exit button is located in the top right corner. Congratulations you have created the your first alert.

Also you can find some useful PromQL queries from here the official Prometheus Cheetsheet.
I hope you like the tutorial, if you do give a thumps up! and follow me in Twitter, also you can subscribe to my Newsletter in order to avoid missing any of the upcoming tutorials.
Media Attribution
I would like to thank Clark Tibbs for designing the awesome photo I am using in my posts.

Latest comments (0)