

- MATLAB has been a game-changer in my life, and I can't wait to share my experiences with you. Whether you're a beginner or someone looking to delve deeper into MATLAB, this blog is for you. Let's explore the fundamentals, features, and real-world applications of this incredible tool, as seen through my eyes.
Embarking on the MATLAB Adventure
Before we jump into the details, let's start with the basics. MATLAB, short for MATrix LABoratory, is a high-level programming environment developed by MathWorks. It's renowned for its user-friendly syntax and powerful capabilities in numerical computation, data analysis, and visualization.
Getting Started: My journey with MATLAB began with the installation process. MathWorks offers various licensing options, including a trial version, which is perfect for newcomers like me.
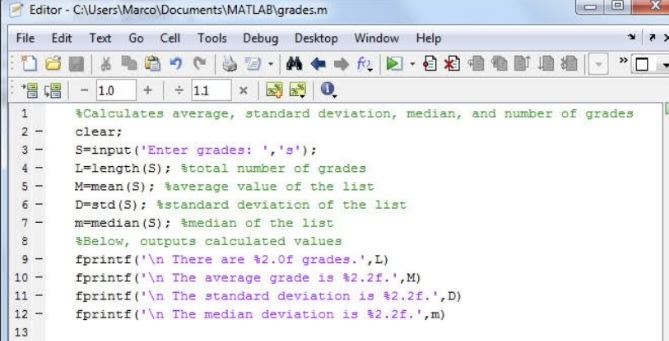
The MATLAB Environment: Once installed, I found myself in the MATLAB environment, with the Command Window for executing commands and the Editor for writing and saving scripts.
Exploring Key MATLAB Features
Now, let's delve into some of the standout features of MATLAB that have made it my go-to tool:
Matrix Magic: MATLAB's forte lies in working with matrices and arrays effortlessly. I was amazed by how easily I could perform matrix operations, solve equations, and manipulate data.
Toolbox Extravaganza: MATLAB boasts an extensive collection of toolboxes covering diverse domains, from signal processing to machine learning. These toolboxes enhance MATLAB's capabilities and make it adaptable to various applications.
Visual Delight: Data visualization in MATLAB is a breeze. With its plotting functions, I created stunning 2D and 3D plots, animations, and interactive visualizations. Customizing plots was a joy, allowing me to convey my findings effectively.
Ready-Made Functions: MATLAB offers a treasure trove of built-in functions for mathematics, statistics, optimization, and more. These functions saved me countless hours of coding and made complex computations a breeze.
Applications That Amaze Me
MATLAB's versatility extends to numerous fields, and I've been awed by its real-world applications:
Engineering Marvels: Engineers use MATLAB for simulations, control systems, image processing, and algorithm development, solving complex problems with ease.
Scientific Insights: Scientists harness MATLAB for data analysis, modeling, and simulations in fields like physics, chemistry, biology, and astronomy.
Financial Wizardry: In finance, MATLAB aids in risk management, portfolio optimization, and financial modeling, helping professionals make informed decisions.
AI and Machine Learning: MATLAB provides a platform for developing and deploying machine learning and deep learning models, making it a go-to tool for data scientists like me.
Academic Ally: MATLAB is a trusted companion in academia, simplifying teaching and research across various subjects.
Conclusion
My journey with MATLAB has been nothing short of transformative. Whether you're a student, researcher, engineer, or data scientist, MATLAB's array of features and toolbox collection can empower you to tackle complex problems and gain insights from data. Learning MATLAB has unlocked countless possibilities for innovation and discovery in my professional life. I encourage you to embark on your own MATLAB adventure and witness the incredible impact it can have on your projects and research endeavors.
I have given some snippets to understand MATLAB:
Arithmetic
a = 5;
b = 3;
sum = a + b;
difference = a - b;
product = a * b;
quotient = a / b;
Variables
name = 'John';
age = 30;
fprintf('My name is %s, and I am %d years old.\n', name, age);
Loop
name = 'John';
age = 30;
fprintf('My name is %s, and I am %d years old.\n', name, age);
x = 10;
if x > 5
disp('x is greater than 5');
else
disp('x is not greater than 5');
end
Adding to it we have some more complex codes:
System of linear equation
% Define the coefficient matrix A and the right-hand side vector b
A = [2, -1, 3; 1, 3, 2; 4, 2, 1];
b = [9; 12; 7];
% Solve for the unknowns x
x = A \ b;
disp('Solution for x:');
disp(x);
Numerical integration:
% Define the function to be integrated
f = @(x) sin(x) ./ x;
% Compute the definite integral from 0 to pi
result = quad(f, 0, pi);
disp('Integral result:');
disp(result);
3D plot:
% Define a grid of x and y values
[x, y] = meshgrid(-2:0.1:2, -2:0.1:2);
% Calculate the corresponding z values (example: a 3D surface)
z = x.^2 + y.^2;
% Create a 3D surface plot
surf(x, y, z);
xlabel('X-axis');
ylabel('Y-axis');
zlabel('Z-axis');
title('3D Surface Plot');
Image processing:
% Read an image
image = imread('sample_image.jpg');
% Convert to grayscale
gray_image = rgb2gray(image);
% Apply a Gaussian blur
blurred_image = imgaussfilt(gray_image, 2);
% Display original and processed images
subplot(1, 2, 1);
imshow(gray_image);
title('Original Image');
subplot(1, 2, 2);
imshow(blurred_image);
title('Blurred Image');


Top comments (0)