Productionizing Observable Notebooks with 3rd party Active Monitoring
I keep my 200+ public notebooks on the observablehq.com platform running by actively monitoring them with a 3rd party monitoring tool uptimerobot. Here is how I got it connected, and how I did it unobtrusively without altering the original notebooks.

Broken notebooks are a big problem. I have encountered many broken notebooks on observablehq.com, and then much later, I have written many more. The thing is, I did not know my old notebooks were broken until I randomly checked! I don't want to host broken notebooks, but I can't be checking 200 notebooks every week, it doesn't scale! Instead, I figured out a way to bring off-the-shelf monitoring solutions to the notebook ecosystem. The best thing is that it can be applied to any notebook. There is no special library or anything to depend upon etc.
Using the Observablehq runtime to create a Healthcheck Metabook
Did you know that all notebooks are packed as ES6 modules, and you can run them inside the open-source Observablehq runtime programmatically? (see Advanced Embedding and Downloading) This means a notebook can find and run code found in another notebook. I call these types of notebooks metabooks as they are higher-order notebooks (notebooks whose input is another notebook).
So, the healthcheck metabook, given a target notebook, runs the target on an internal Observablehq runtime and looks for errors.
  const [{ Runtime }, { default: targetNotebook }] = await Promise.all([
    import(
      "https://cdn.jsdelivr.net/npm/@observablehq/runtime@4/dist/runtime.js"
    ),
    import(`https://api.observablehq.com/${settings.target}.js?v=3`)
  ]);
  new Runtime().module(targetNotebook, (name) => {
    // cell observers
    return {
      ...
      rejected(error) {
        // cell threw an error
        ...
      }
    }
  }
Using the runtime hooks we can detect if a cell throws an error, which will pick up many common forms of notebook rot. To attach 3rd party monitoring though, this error detector needs to be exposed as a HTTP service for 3rd party consumption.
Exposing a HTTP service with WEBcode.run
We use a Observable native functions-as-a-service runtime WEBcode.run to expose an endpoint on the internet.
With WEBcode.run you define a handler for requests that write back to a response. Because it executes in the notebook, you get access to all the notebook functionality. In our case, we decode a target notebook from a URL parameter. The API is modelled after the Express 4.0 API (see req, res for details).
endpoint(
  "default", // For a simple URL we use the default name
  async (req, res) => {
    const target = req.query.target; // Read the target notebook.
    run(target, excludes); // start health checking

    setTimeout(() => {
      // There is no clear stopping point so we just run it for X seconds
      const errors = viewof errors.value; // collect errors
      res.status(errors.length > 0 ? 503 : 200).send(
        JSON.stringify({
          errors: errors.map((e) => ({
            cell: e.cell,
            message: e.error.message
          }))
        }, null,2 )
      );
    }, 5000);
  },
  {
    reusable: false, // This does not support concurrent operations
    modifiers: ["orchistrator"] // This endpoint can call other endpoints
  }
)
Our handler starts the healthcheck process, and after 5 seconds reports, if errors are found.
So, to check for errors on notebook @tomlarkworthy/view, we make a request using curl to
curl 'https://webcode.run/observablehq.com/@endpointservices/healthcheck?target=@tomlarkworthy/view'
Because 3rd party monitoring tools typically just check HTTP status codes, our handler returns a status code 503 (unavailable) if errors are detected, or 200 (OK) otherwise.
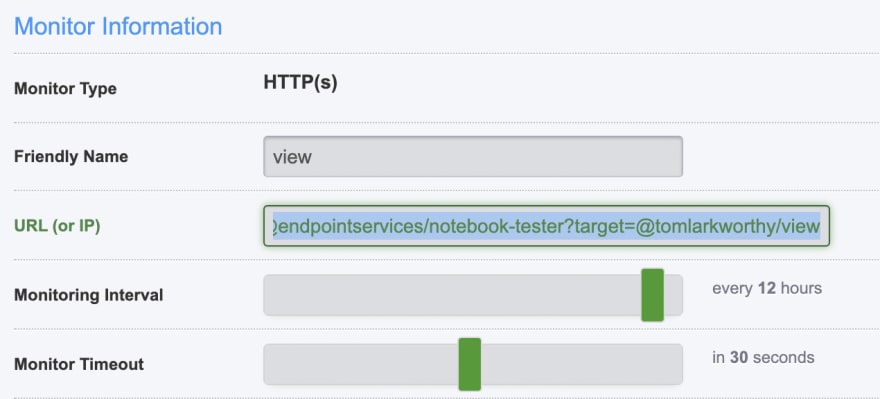
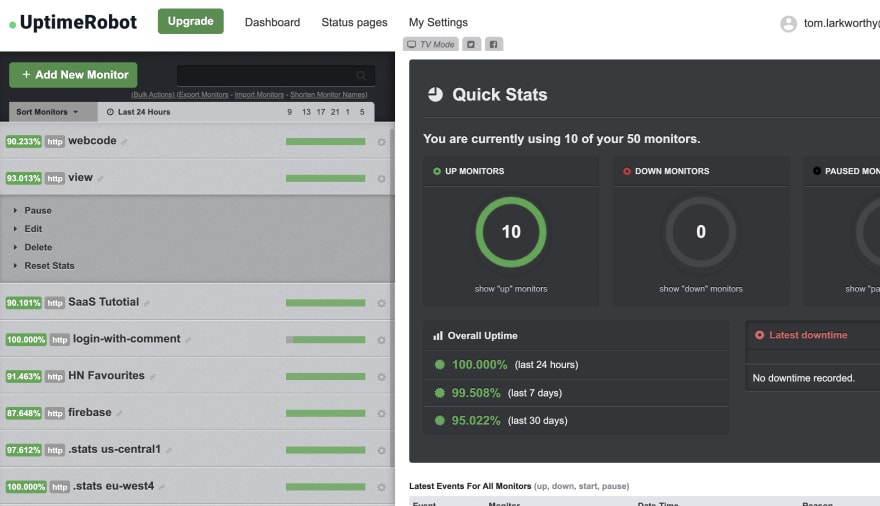
Attaching UptimeRobot
UptimeRobot is a very simple to use active monitoring service and it will provide 50 monitoring jobs for FREE!
Active monitoring will poll the provided URL on a schedule, log the status, and alert via email/SMS/webhook if an error code is seen.
Unit tests, Sentry
Being able to actively monitor my notebooks for errors has completely changed my anxiety levels. By looking at my dashboard I can see that all my main notebooks are running well. As I am building a business upon Observablehq, I must keep everything working, so seeing my code has run successfully is reassuring.
The biggest change is that when an error is reported by an end-user, I now convert that issue into a unit test. Because unit tests errors are runtime errors, a healthcheck over a notebook containing a test suite will alert on unit test failures. So now I can fairly confidently ensure that particular issues never happen again.
I also use sentry.io to automatically report errors, whether generated by user usage, or by healthcheck monitoring (see this notebook). Again, for low usage, Sentry.io is a FREE service. Sentry compliments UptimeRobot by logging context around an error, and also it runs in user devices like iPhone which can sometimes have their unique issues.
I am very excited that we can take a developer-friendly product like Observablehq and still fit it into the existing DevOps infrastructure. It suggests that building high-quality software on Observable is possible, and maybe preferable. I love Observable, in that, for all its workflow cleverness, it's still just Javascript running idiomatically in a browser, and thus, we can leverage existing specialist tools that already exist in the ecosystem. There is no need to reinvent the wheel when using Observable! I hope this story helps you get to the reliability levels you want out of your software hosted on Observablehq.
I tweet lots of Observable stuff at @tomlarkworthy, and occasionally launch things on Product Hunt


Top comments (0)