
Having a fast site has always been important for visitor experience and search engine optimization (SEO). But how do you know if your site is fast? Typing your site's URL into the browser and watching it load can tell you a thing or two, but we want numbers. We want metrics!

In this article I'll cover three web performance indicators to care about: first contentful paint, largest contentful paint, and time to interactive. There are a lot more metrics out there, but these three give you a good look into visitor experience on your site. You'll learn why these performance metrics matter and how to measure them on your own site.
Let's jump in.
First Contentful Paint (FCP)
The time it takes for the FIRST text or image to be painted on the screen. It's probably not what your visitor came for but its anything being painted on the screen. This is the first thing your visitor sees on the page. Your site visitors want some sign that your site is working on their request. Seeing a blank page is discouraging. Even a loading spinner is better than nothing.
Google wants your FCP time to be under 1.8 seconds to be in the green zone. Anything more and you are compromising the user experience on your site. (https://web.dev/first-contentful-paint/)
Largest Contentful Paint (LCP)
The time it takes for the largest image or text block to become visible. The megabytes or kilobytes do not come into consideration here. This is all about physical screen real estate.
The assumption is that the largest physical piece of content to be rendered to the page will be what the user came to see. For example, for this blog post you are reading now, the text is the largest piece of content and it is indeed what you came for; I hope.
A good LCP time is anything under 2.5 seconds. Visitors want to see what they came for in 2.5 seconds or less. (https://web.dev/first-contentful-paint/)
Time to Interactive (TTI)
The time it takes for the page to become FULLY interactive. This is important because some pages prioritize visuals and will load up a beautiful-looking page. But when you try to click a link or scroll the page, it appears frozen. The page looking complete but not interactive is a big disruption in user experience.
Under 3.8 seconds is considered a good TTI score by Google. (https://web.dev/interactive/)
There are more performance indicators out there, but FCP, LCP, and TTI can give you a good overall idea of how your site is performing.
How to measure web performance?
https://web.dev/measure/ gives you an easy way to measure the performance of your site. Type in your URL, click Run Audit, and you will get your results shortly after.
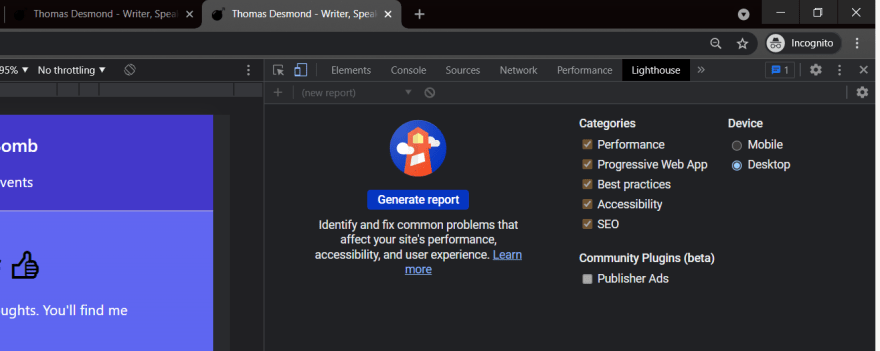
You can also run a test directly in Chrome using the Chrome Dev Tools (Open by pressing F12). Lighthouse is usually the farthest right tab at the top, so it might be hard to see. I prefer using Chrome Dev Tools because then I can put Chrome into Incognito mode. When in Incognito mode, you usually get better results because certain things like extensions, tracking, cookies are disabled.
Both tools will give you the FCP, LCP, TTI, and a good deal of other metrics.
The performance of your website is extremely important. Every visitor wants their results instantly. It's up to you to monitor your site and optimize where appropriate. Diving deeper into web performance there are many many factors but a great starting point is focusing in on first contentful paint, largest contentful paint, and time to interactive.
If you use one of these tools, let me know. Share your results with me on Twitter @ThomasJDesmond!

Top comments (0)