To analyze the data, we need to understand the characteristics of data first. But reading the data is not an easy task. Spreadsheet application can help us to read data efficiently with table or sheet but if the data is huge, we could get some difficulties from it. For example below is the Wage (Github link) data which contains income survey information for males from the central Atlantic region of the US, part of the book 'An Introduction to Statistical Learning'. It has 3,000 rows and 12 columns containing the summary of wage data by year, age, region, and so on.
We can check with pandas like below,
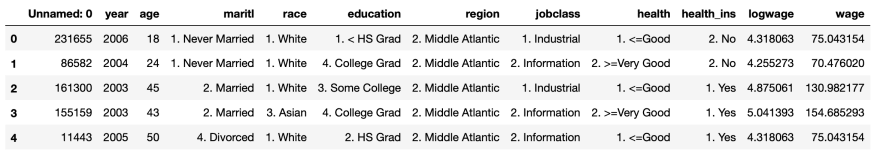
df = pd.read_csv('Wage.csv')

df.head()
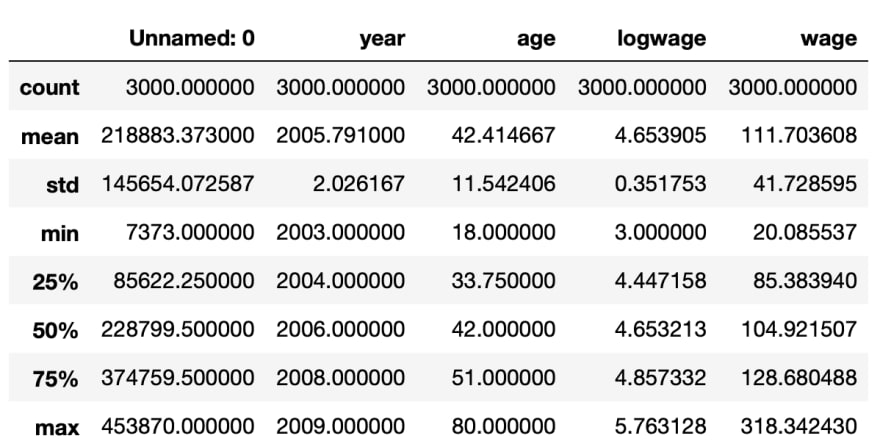
And we can see the basic statistical values from data with below python statement,
df.describe()
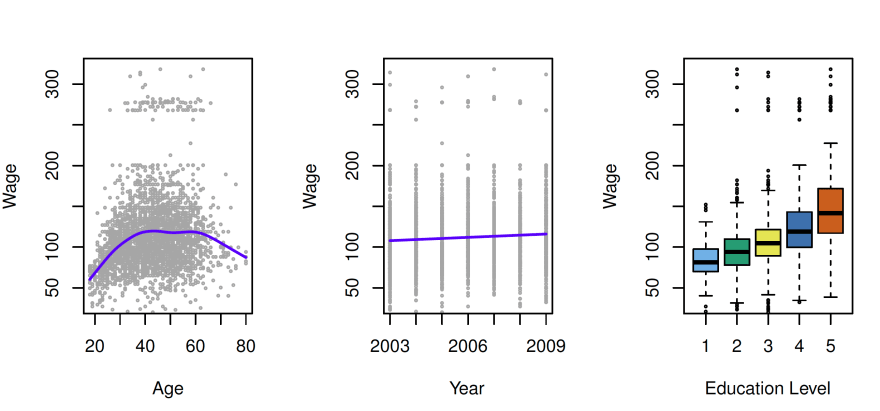
we can get some information from data with tables, but it could not give a clear understanding of the data. Because the table and text do not tell us the story of data.
But with some image like below, we can see, the change of wage by ages, year, and education level at a glance.
As we saw above, it is becoming much easier to read the data by visualization with a chart. We can have much information through the data simultaneously. In these days, there are lots of convenience tools for drawing a chart from data. Microsoft Excel and Tableau is a famous and powerful application for organizing the data and draw and it is the best fit for most business cases. And there are also online tools that support the various style of charts such as Google Chart, Online chart tool, and so forth. By using these kinds of chart tools we can have various chart without much difficulty.

All of the tools are very convenient but still have some limitations. We need to follow their rules and methods for them.
But by writing code with python, we can draw a chart much freely. One of most strength of Python is, it has lots of chart libraries that we could get the various visualized form of data. We can make a general chart with matplot, plotly, seaborn, and we can also draw some plot on the map with folium, basemap, and there are a bunch of more chart libraries that make our life easier.

Most of the data can be presented by the chart but how about the text data. There are a few methods that visualizing the text with the chart. But the most interesting method is called 'Word Cloud' that expressing the kind of chart with text. A word cloud is an image made of words that together resemble a cloudy shape. The size of a word shows how important it is e.g. how often it appears in a text — its frequency. Here is an example of Word Cloud.
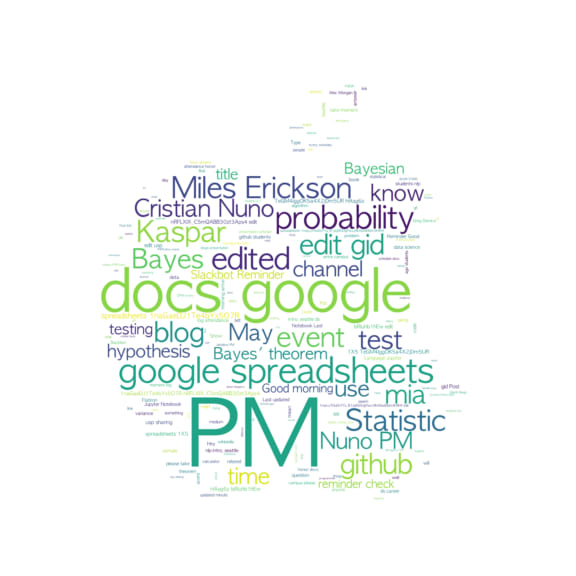
Word clouds typically used to easily produce a summary of large documents (reports, speeches), to create art on a topic (gifts, displays) or to visualize data (tables, surveys). But it was a little hard to produce word cloud, you should count the words in some text and draw it with art tools such as Photoshop or Illustrator. But with wordcloud Python library, it is super convenient. You can make a word cloud within several lines of code.
texts = 'Dog Cat Animal Carmel Snake'

wordcloud = WordCloud()

wordcloud = wordcloud.generate_from_text(texts)

plt.figure(figsize = (8, 8), facecolor = None)

plt.imshow(wordcloud, interpolation="bilinear")

plt.axis("off")

plt.tight_layout(pad = 4)

plt.show()

Try to make a creative word cloud with Python codes!!!

Top comments (0)