webMethods EntireX
Get a brief overview of how you monitor your EntireX environment and which method to select.
| Issue 3, 2017 |  Download PDF Download PDF |
|---|
You can monitor your EntireX environment in different ways. The way you choose for your situation at hand also depends on the component and your own needs:
- Application monitoring
- Monitoring with Command Central
- Monitoring from Command-line
- Monitoring with Optimize for Infrastructure
- Monitoring the EntireX Adapter for Integration Server
- Watching the Default Broker View in Designer/EclipseTM
The first method differs from the others significantly. You can monitor an EntireX application along its message path back and forth, measuring response times at numerous measuring points.
With the other methods you monitor EntireX on an infrastructure component level. You can get information of the EntireX Broker or of Remote Procedure Call (RPC) servers, for example.
Read about all of them to choose the right method for your organization.
Application monitoring
With application monitoring you can monitor the response times in your distributed applications, as well as a couple of error situations. Use this method if you want to know where time goes to in an EntireX application scenario.
The EntireX Application Monitoring Data Collector collects the response time data of each involved software component of selected synchronous EntireX RPC services. The Application Monitoring Data Collector stores the Key Performance Indicator (KPI) values in Comma-Separated Values (CSV) files. The files can be processed by any tool that supports CSV files.
Use this method if you want to have a quick look via Microsoft® Excel® or if you want to feed the CSV files into a different kind of tool. The collection into CSV files has been available since EntireX 9.7.
- Alternatively you can hook in your own monitoring back-end. To do so you can use the Callback User Exit of the Data Collector. Write a Java® class that implements the DataCollectorCallback interface and make it known to the DataCollector. Use this method if you want to feed arbitrary monitoring backends in real time. The DataCollectorCallback for Java has been available since EntireX 9.9.
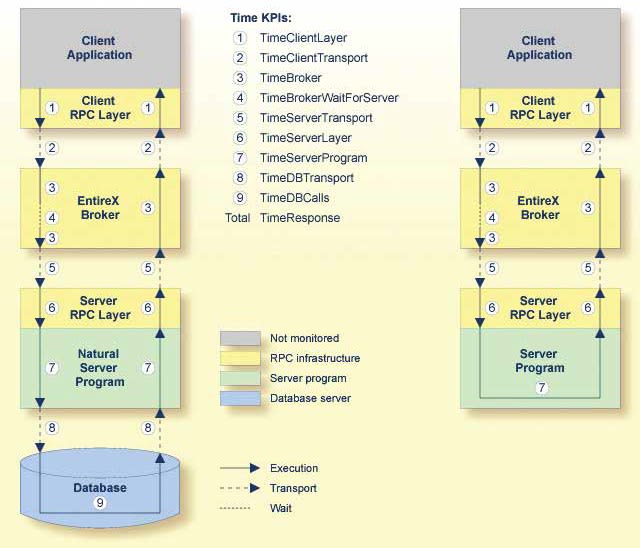
Fig. 1: Time KPIs in EntireX Application Monitoring
When a service has been selected for monitoring, each call to the service by a client application is monitored. The overall service response times, the network transport times, the EntireX Broker processing and waiting times, the RPC server processing times, and the time spent for database calls are measured. Each involved Software AG enterprise product concatenates the monitored times with the service call. When the call returns to the client, the client RPC runtime provides the event data to the Application Monitoring Data Collector.
In addition to monitoring RPC scenarios as described above, you can also monitor scenarios where the EntireX Adapter is used to call transactions using CICS® ECI or IMS® Connect.
To learn more, read Application Monitoring from webMethods EntireX documentation.
Monitoring with Command Central
Software AG Command Central is a tool you can use to perform administrative tasks remotely from a single location. It can assist with configuration, management and monitoring tasks. As an operator you can monitor server status and health, as well as start and stop servers from a single location. You can also configure alerts to be sent in case of unplanned outages.
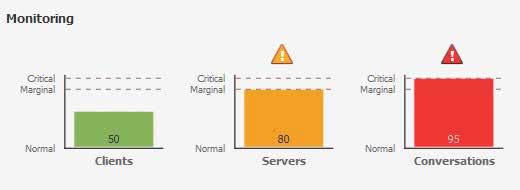
For each registered instance, you can see up to three KPIs in Command Central’s instance overview. If you need to get a quick overview of your instance landscape, then Command Central seems to be the best choice.

Fig 2: EntireX Broker KPIs in Command Central
EntireX Broker instances that were installed via Software AG’s installer or via Command Central can be managed within Command Central. This capability has been available since EntireX 9.9. This currently includes EntireX Brokers running on Linux®, UNIX® or Windows®. Support for EntireX Brokers on additional platforms is planned for a future release.
Coming with EntireX 10.1, a first set of RPC servers running on Linux, UNIX or Windows is also supported with Command Central.
To learn more, read Administering EntireX Broker with Command Central from webMethods EntireX documentation.
Monitoring from Command-line
There are three different ways to monitor from Command-line:
- Command Central
- ETBINFO
- Command-line Scripts
Command Central also offers a Command-line. You can submit a broad range of operations.
ETBINFO is the EntireX Broker information service. You can query all types of information the broker provides – remotely or locally from most EntireX Broker platforms.
To learn more, read Broker Command-line Utilities from webMethods EntireX documentation.
EntireX provides a set of Command-line Scripts as a solution to the following scenarios:
- "I want a quick overview of my standard broker and a list of active external services that are running"
- "I want to monitor an EntireX component (broker, service or client) over time"
- "I want to monitor my environment and check that all components (broker, RPC servers) are up and running"
You can select the scripts from the EntireX Command-line Scripts Menu or call the individual scripts from the command-line. These scripts are all based on ETBINFO to query their information.
Although these scripts run on Windows platforms, you can use them with local or remote brokers on any other platform. The scripts were introduced with EntireX 9.7, but can be used with brokers of any supported version.
To learn more, read Monitoring EntireX with Command-line Scripts from webMethods EntireX documentation.
Monitoring with Optimize for Infrastructure
Optimize provides you the most comprehensive solution for infrastructure component monitoring. It covers all major Software AG components, like Integration Servers, Adabas, ApplinX, Natural, Com-plete, EntireX and many more.
Optimize enables you to monitor all Software AG component resources in real time. The Infrastructure Data Collector monitors the system and operational data associated with Software AG runtime components and reports the status of these components with Optimize for Infrastructure.
You can find out, for example, the number of calls to a database in the interval, the number of calls to EntireX Broker in the interval, the number of logons denied in Natural Security, and many more. Diagrams showing the values of the KPIs over time are visualized in the My webMethods user interface.
Use Optimize for Infrastructure to monitor the status of individual managed objects as well as the overall status of your system.
Optimize implementations perform the following main functions:
- Data collection
- Data communication
- Data processing and analysis
- Data storage
- Data presentation
To learn more, read Guide for Adabas, Natural, ApplinX and EntireX Systems from webMethods Optimize for Infrastructure documentation. This guide is also known as Guide for Enterprise Transaction Systems.
Monitoring the EntireX Adapter for Integration Server
If you’d like to monitor the EntireX Adapter for Integration Server (IS) then your best choice is the IS Administration Console, like for any other IS adapter. You will find basic information as well as statistical values of connections, services and listeners there.
Moreover, you can reset the statistical values from the IS Administration Console.
To learn more, read Settings and Information from webMethods EntireX documentation.
Watching the Default Broker View in Designer/Eclipse
If you are a developer of integration scenarios, then your tool of choice is the Eclipse-based Software AG Designer. The EntireX parts therein are also known as EntireX Workbench or EntireX Designer.
Use the Default Broker View, if you need to know, whether your local default EntireX Broker is running, or whether relevant RPC Servers are connected to it. For this purpose, the EntireX perspective provides you with the Default Broker View. You don’t have to leave the Designer to get this basic information.

Fig 3: EntireX Default Broker View
In addition, you can do basic administration tasks with your local default EntireX Broker as well as shut down connected server instances or services.
To learn more, read EntireX Default Broker View from webMethods EntireX documentation.
Summary
Now you have a basic understanding of the many ways to monitor your EntireX environment. Choose the right method for your unique situation. Need more details? Visit TECHcommunity or talk to your Software AG representative.


Top comments (0)