I completed the Cloud Resume Challenge posted by Forrest a couple months ago and when I saw this posted I knew I had to give it a try. On paper this challenge seemed a bit easier than the last but I ended writing more code and learning even more throughout it. Below I'll explain how I worked through each step of the challenge and my thought process through it, so without further ado let's get into it.
The main challenge page can be found here
The finished product has be seen here
Repo for this project GitHub
My LinkedIn Tejas Bhagat
IaC, Source Control, CI/CD
- I found it easier in the last challenge to make improvements and changes after the above was setup so I went ahead and started with this. My IaC template was basic at first with just my lambda and DynamoDB but as I worked through each step it was easier to write a couple lines in my yaml template to add the other services as needed.
- I wanted to make the dashboard public so when I got to creating the dashboard I ended up including another lambda function and API gateway as well.
Extraction
- To extract the data I used Pandas to read the data from the New York Times and John Hopkins Github sources and pass the data in to my Transformation function.
Transformation
Here I again used Pandas, this time to convert the data to data frames and then formatting, filtering and joining for my needs. The John Hopkins data was filter to only show U.S data and then I merged the Recovered data column to the cleaned New York Times data. At one point I had the dates converted to Date objects but I found that I could not load Date Objects into DynamoDB and loaded them as strings instead.
I also Included data validation in this phase to make sure the Dates were in correct format and Deaths, Cases, Recovered were all integers and greater than 0.
Load
- Once the data was cleaned I was able to load it all into my using DynamoDB by using boto3. Here I have the new data date field check against what is already in the database and if it already exists it does not load it. If the data does not exist in the database it would be loaded and a SNS notification is sent to subscribers of how many dates were added as well as the cases/deaths/recovered for each date.
- Throughout the extraction, transformation and load process I have try: and except: code blocks which would exit the lambda and send subscribers a notification for errors which occur in the process. One of the most difficult steps of the challenge was writing tests for me, I was able to write a couple tests to check for malformed data and it does indeed throw an error and send the SNS message.
Dashboard
Once I had all the data in my database I was thinking of ways to make it public and add it to my site created in the last challenge. I remembered I did something similar with the visitor counter during the Resume challenge using API gateway, Lambda and DynamoDb so I decided to try that here as well.
I added another lambda which pulls the current data from the database and hooked it in with API gateway so I can use it on my site. Now that I was able to reach the data through my API I had to figure out how to use, I did some research and ended up going with Google Charts. Here I wrote some JavaScript and fiddled with HTML until the product was what I imagined.
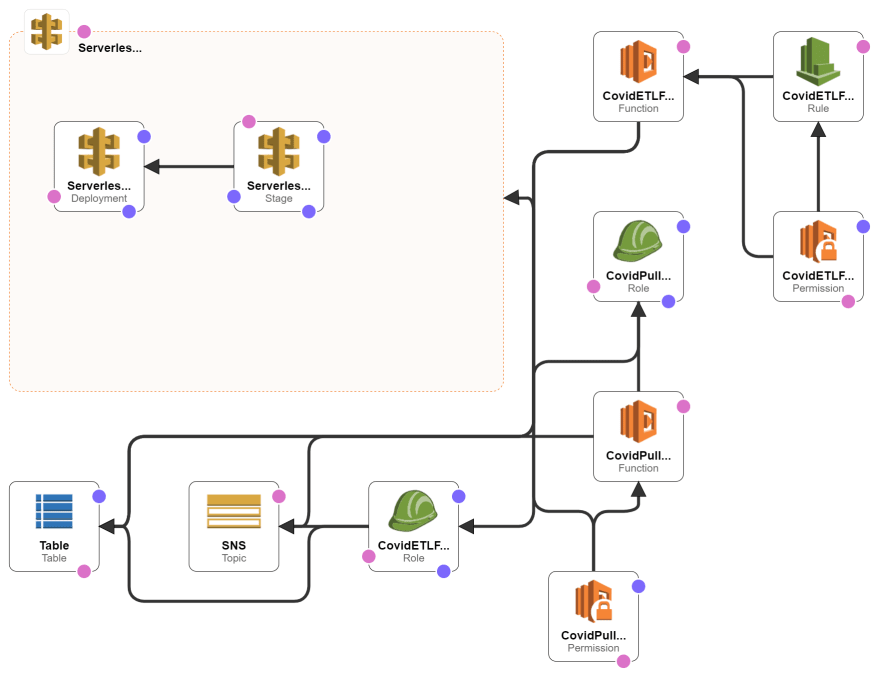
Final architecture for this project.
In the future I’d like to try to reduce the load times of the charts and make it more interactive for the end user so they are able to see exactly what they need.
Overall this was a very fun project where I was again able to learn a lot, what I learned here will let me think bigger and better for my future personal projects and future challenges. Huge thank you to Forrest and A Cloud Guru for these challenges!


Top comments (0)