Monitoring and analytics have been an issue for Serverless systems since they were invented. While it's easy to attach an agent like NewRelic or DataDog to a server or container, function monitoring requires a different approach. Serverless applications, where logic is distributed over a large number of functions, attaching agents or wrappers leads to cost increase and development overhead. To provide insights into FaaS architectures, Dashbird collects all your CloudWatch logs and extracts meaningful and actionable metrics.
Dashbird is a service that simplifies AWS monitoring and error alerting by collecting and analyzing CloudWatch logs and translating them into actions categorized as critical, warnings, and info. On top of preconfigured error alerts, you can also set customized alerts for whatever is important for you.
The service takes advantage of the fact that Lambda functions emit logs with a lot of useful, pre-formatted information. With smart parsing, Dashbird provides time-series metrics for invocations, memory usage, durations, while also sorting and displaying invocations separately. Every piece of data is then culminated into a single dashboard that offers a bird's eye view of your entire system and points out problematic areas. It also acts as an error-alerting system, by recognizing exceptions, runtime errors, configuration problems, and timeouts and sending an email or Slack notification in real-time.
Dashbird requires minimal effort to set up and has no cost effect on your AWS bill. Onboarding requires a delegation to your AWS account, which allows the service to get basic data about Lambda functions and collect their logs from CloudWatch. There is no additional code needed or any intrusion to your existing infrastructure.
Enhanced AWS Monitoring
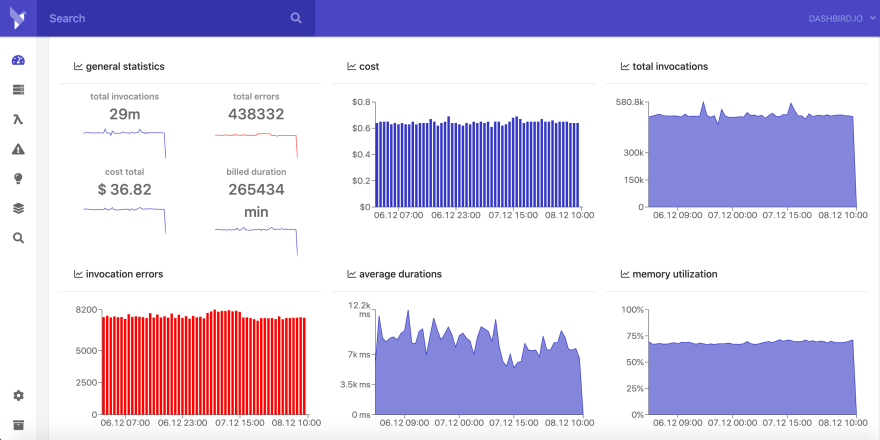
Dashbird captures all things Serverless in a single view, preventing problems from going unnoticed and gives developers an understanding of the traffic trends in the system. The main page consists of time-series metrics for invocations, mean durations and memory usage, health stats, billed duration, error reports, and function-level load distribution. From there, you can drill down into any metric or locate misbehaving functions and troubleshoot issues.
Dashbird's single function view gives you execution, duration, and memory usage graphs, along with errors, statistics, and invocation listing. You can use this insight to optimize memory usage or view the average latency, while also seeing errors and search and live tail a Lambda function. Making for debugging and development easier and one step ahead.
Error alerting

Dashbird has a no BS approach to error detecting and alerting. It finds all runtime problems like crashes, exceptions, early exits, and configuration errors and integrates with Slack, email, SNS, and webhooks. What sets it apart from other error trackers, is its ability to find timeouts and configuration errors. These errors do not get notified to APMS that rely on sending data with a net request, since the execution is halted immediately.
Dashbird also aggregates error data, so that you can track the relevance and magnitude of a recurring error and find overlaps in the Lambda logs that help with debugging.
Set up and cost
Creating the delegation takes about two minutes, and the setup screen guides you through it with a few simple steps. After that, the data will start pouring in immediately and you will learn stuff about your system and unknown errors in a matter of minutes. Apart from logs:deleteSubscriptionFilter and logs:putSubscriptionFilter, Dashbird only requires read rights to your AWS account.
In the first 14 days, Dashbird offers an unlimited amount of data for an unlimited amount of functions. Here are the full pricing details.
Wrapping up
If your application logic is distributed over large amounts of functions, it makes a lot more sense to collect information from the logs rather than sending telemetry at the execution time. Dashbird introduces what will one day be the de facto standard for Serverless monitoring. If you're building on AWS Lambda, Dashbird is one of the best tools for enhanced AWS monitoring and improving your Serverless architecture thanks to its Well Archiotected Insights engine, analyzing your data and translating it into easy-to-understand critical, warning, or info actions.


Top comments (0)