
Please reach out to me on Twitter @nathangloverAUS if you have follow up questions!
This post was originally written on DevOpStar. Check it out here
Google's Lighthouse CI is a programmatic tool that allows you to analyse your web apps and generate detailed reports around best practices building for the web. In this post we're going to explore how we might integrate these tests into our GatsbyJS build pipeline.
By the end of this post you will have a basic understanding of how you can run the Lighthouse CI tool, analyse the results and make effective changes to modernize your website.
What is Lighthouse?
Lighthouse is a Google Chrome tool that allows you to analyse your website for best practices with the modern web in mind. It can be found in the Google Chrome browser under the Audits tab, where you can run a check by simply clicking Generate report

The reports themselves consist of a variety of best practices and recommendations for improving your websites performance on both mobile and desktop browsers

Adding Lighthouse CI
The following is the method I prefer when adding Lighthouse CI to my GatsbyJS projects. We add a couple things to our project package.json so we can run 1 command to trigger the entire pipeline.
  "scripts": {
    ...
    "build": "gatsby build",
    "serve": "gatsby serve --host=0.0.0.0",
    "test:lh:ci": "lhci collect --start-server-command='npm run serve' --url=http://localhost:9000 --settings.chromeFlags='--no-sandbox'",
    ...
  },
Now add the Lighthouse CI tool to the project devDependencies
npm install @lhci/cli --save-dev
The additions above allow us to simply run the following in order to trigger a Lighthouse CI audit
npm run test:lh:ci
The outputs from the Lighthouse test can be found in the .lighthouseci folder in your project. These can be viewed by opening the *.html files that accompany the reports (which are output in JSON format).
Note: If you don't have the html reports, you can actually view the outputs of the json file by uploading them to the Lighthouse Report Viewer website
Let's take a look at the output from one of my previous tests. In this example I scored pretty high for everything except performance

Drilling down into the reasons why the results weren't optimal I find out that there are images on my site that don't conform to next-gen image format standards. In this case I have an image that is png that could be webp.
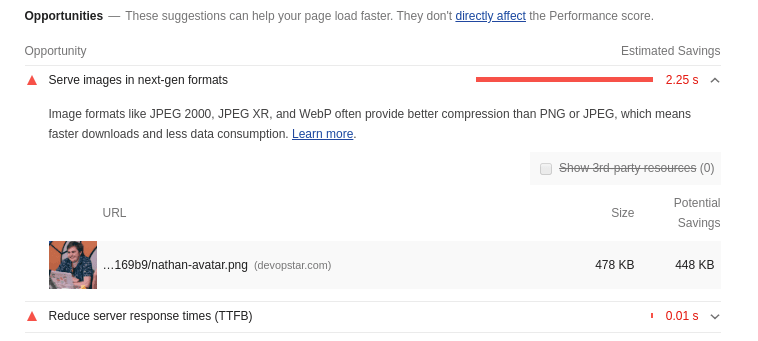
Clicking on the links provided under the opportunities will take you to helpful guides on solving your problems. In my case I simply converted my image to webp using the binaries provided.
$ cwebp -q 50 ~/Downloads/nathan-avatar.png -o ~/Downloads/nathan-avatar.webp
# Saving file '/home/nathan/Downloads/nathan-avatar.webp'
# File:      /home/nathan/Downloads/nathan-avatar.png
# Dimension: 450 x 455
# Output:    14976 bytes Y-U-V-All-PSNR 37.34 41.70 39.74   38.18 dB
#            (0.59 bpp)
# block count:  intra4:        640  (76.10%)
#               intra16:       201  (23.90%)
#               skipped:        27  (3.21%)
# bytes used:  header:             65  (0.4%)
#              mode-partition:   2915  (19.5%)
#  Residuals bytes  |segment 1|segment 2|segment 3|segment 4|  total
#     macroblocks:  |       4%|      23%|      40%|      33%|     841
#       quantizer:  |      52 |      47 |      39 |      28 |
#    filter level:  |      16 |      10 |      24 |      24 |
AWS CodeBuild
Running the reports locally is all well and good, but ultimately we would prefer to have them run every time we update our website. In the following example I'll show you how to integrate with AWS CodeBuild
Note: although not necessary I would recommend checking out the Migrating WordPress to GatsbyJS - Architecture & CI/CD blog post first, as we go through how to setup GatsbyJS builds on CodeBuild.
Below is an example of how I integrate Lighthouse CI into my buildspec.yml file for CodeBuild. There is a requirement to have the Chrome browser installed on the build server, so the first thing I do is install that.
version: 0.2

phases:
  install:
    commands:
      - sudo apt-get update && apt-get install -y libglu1 chromium-browser
  pre_build:
    commands:
      - rm -rf .lighthouseci/ || true
      - npm install
  build:
    commands:
      - npm run build
      - npm run test:lh:ci
artifacts:
  files:
    - '.lighthouseci/*'
  name: devopstar-$(date +%Y-%m-%d)
I have also included an artifact bucket to demonstrate that you can store the outputs of each report for analysis later on.
Pulling down these reports can be down with the AWS CLI
aws s3 cp \
  s3://${bucket-name}/${build-id}/lighthouse lighthouse && \
  unzip lighthouse && \
  rm lighthouse

# Archive:  lighthouse
#   inflating: .lighthouseci/lhr-1582721362931.html
#   inflating: .lighthouseci/lhr-1582721390232.html
#   inflating: .lighthouseci/lhr-1582721390232.json
#   inflating: .lighthouseci/lhr-1582721376592.json
#   inflating: .lighthouseci/lhr-1582721362931.json
#   inflating: .lighthouseci/lhr-1582721376592.html
Summary
Hopefully with some of the ideas above you'll be better equipped to start auditing and tracking your sites performance. These metrics tracked over time can give you a good goal post to continuously try to run towards!
What did you think of this post? Did it help you? Please let me know on Twitter @nathangloverAUS!


Top comments (0)