
Debugging is a vital part of identifying why your application is misbehaving. We feel great satisfaction once we find the bug in our code and fix it.
No matter how skilled we get as developers, we still have to spend countless hours fixing bugs in our code. Thus, we should work on improving our debugging skills. If you work with JavaScript, you know it is not always cooperative. Fortunately, several JS debugging tools are accessible, usually making troubleshooting straightforward.
This article will discuss how we can debug JavaScript using the simple and efficient tools in Visual Studio Code and Google Chrome.
Debugging Methods for JavaScript
Breakpoints
A breakpoint is where a line of code causes the debugger to pause JavaScript execution. We can examine current variables and run commands in the console while the code is paused. To put it another way, we can debug it. A list of breakpoints is always available in the right panel of Chrome DevTools. This is useful when we have a lot of breakpoints in different files.
Debugger Keyword
In JavaScript, we can also use the debugger keyword. The keyword causes code execution to pause. However, the browser will ignore such a command unless the development tools are open. See the following example.
function writefunction()
{
  console.log("Stop Executing write function!");
  debugger; // <-- the debugger stops here
}
helloWorld();
Backtracking
Backtracking is the process of applying potential solutions to a problem in a JavaScript program. The procedure begins at the location where a specific error is discovered. From there, the complete source code is traced backward. The stages involved in this are:
- Identify the callers of each function.
- Determine whether any issues connected to that function have occurred there.
- If not, you go back to the caller of that function. If it doesn’t work, you retreat and try again.
Keep repeating this until the error is removed and the expected output is obtained.
Strict Mode
Using JavaScript’s strict mode makes writing standardized and readable JavaScript programs easier. We can put a program under a strict operating perspective by using strict mode. This strict context forbids specific actions and throws exceptions. It helps reduce bugs and keep the code clean. For example, JavaScript will throw an error in strict mode if we assign values to undeclared variables. The use strict statement enables the strict mode.
Debugging JavaScript in VS Code
VS Code provides easy and straightforward solutions for debugging. Visual Studio Code debuggers support many languages and platforms, which are either built-in or accessed by extensions. Let’s work on VS Code debugging with sample JavaScript code.
const hotels = [];
export function addHotel(hotel, stars)
{
    const id = ++hotels.length;
    let numType = 'odd';
    if (id % 2)
    {
        numType = 'even';
    }
    hotels.push({ id, hotel, stars, numType, });
}
In this example, you will notice some common bugs. Let’s ignore them for now and add some lines to test the code manually.
addHotel('Kingsburry', '5');
addHotel('Hilton', '5');
addHotel('Cinnamon Grand', '5');
Now, let’s use VS Code’s built-in *breakpoints * to break the program’s execution wherever we want to test when the bugs occur.

We discussed breakpoints. As you can see in the previous code, the red dots on the left side of VS Code editor are the breakpoints. You can add these by clicking on the panel to the left of the line numbers. Then, on the action bar, click the debug icon.
![]()
Take a look at the top section. You will notice a gear icon. Click it. A debug configuration file named launch.json will be prompted. Update the configuration with reference to the following code to enable the VS Code debugger on App.js.
"configurations": [
   {
      "type": "node",
      "request": "launch",
      "name": "Launch App",
      "program": "${workspaceFolder}\\debugapp\\src\\App.js"
   }
]
Now, click the play icon at the top of the debugger panel. A toolbar will appear at the top of the VS Code. The toolbar will contain several icons you can use to manipulate the debugging process.

In the previous screenshot, you’ll notice that the debugger has paused on your first breakpoint. To continue the session, press the play icon, which will cause execution to continue until it reaches the next breakpoint. Clicking the play icon again will finish the execution and end the debugging session. Let’s understand what the sections on the left pane provide us with:
- Variables : displays the current scope’s local and global variables (at the point of execution).
- Watch: you can manually enter expressions for variables you want to monitor.
- Call Stack: displays the highlighted code’s call stack.
- Breakpoints: shows a list of files with breakpoints and their line numbers.
Debug with Watch
The watch panel tracks expressions in our code. The expression will be evaluated on whether it satisfies the criteria set here. You can watch a new expression by clicking the + in the panel and entering an expression.
Conditional Breakpoints
Watching variables alone isn’t always enough. For example, say we wish to pause the debugging only if a specific requirement is met. Add a standard breakpoint to accomplish this. After adding the breakpoint, right-click on it, choose Edit Breakpoint , and add the conditional statement expression for which you need to pause the debugging.
Call Stack
The call stack helps trace exceptions and determine who called what. You can select an item listed in this pane to see who called it.
Another tool in your VS Code toolbox for debugging is using the debug console. Although it may occasionally be excessive, it will frequently save you time when looking for bugs.
Debugging JavaScript with Google Chrome
The majority of IDEs and almost all recent browsers include debugging tools, which makes debugging much more straightforward. The browsers also allow for step-by-step code tracing to pinpoint the exact cause of the error. Google Chrome, which many developers use, provides us with debugging solutions for JavaScript. In addition, Chrome provides debugger extensions for VS Code and Chrome DevTools. Chrome DevTools comes built-in with the Google Chrome browser.
Chrome Debugger for VS Code
Chrome’s debugger helps debug client-side JavaScript code, which runs in Google Chrome straight from VS Code. The Chrome debugger is an extension that needs to be installed in VS Code.
The debugger usually connects to Chrome over its Chrome Debugger Protocol, where files loaded in the browser are mapped to the files opened in VS Code. You can set breakpoints directly in the source code and set up variables to watch along with the entire call stack when debugging without leaving the editor.
Due to the inclusion of a JavaScript debugger in Visual Studio Code, this extension is no longer supported (deprecated) there. The JavaScript debugger fixes problems with Node.js, Chrome, Edge, WebView2, VS Code extensions, and other programs. You can remove the Chrome debugger extension without risk and still have access to the required capabilities.
Chrome Developer Tools
The finest debugging tool is already included with your Chrome browser, whether you’re working with Angular, React, or Vue applications. The Google Chrome browser includes developer tools (also known as DevTools) that allow developers to edit code directly in the browser, add breakpoints to detect issues, and debug their code more quickly.
To open the DevTools Elements panel, press Command + Option + C on a Mac or CTRL + SHIFT + C on any other operating system.
Let’s review some practical strategies for debugging your code more efficiently with DevTools.
Adding Breakpoints in DevTools
- Navigate to the Sources tab in the DevTools.
- In the navigation panel on the left side, select the .js file. The code of the selected .js file will be displayed in the middle panel.
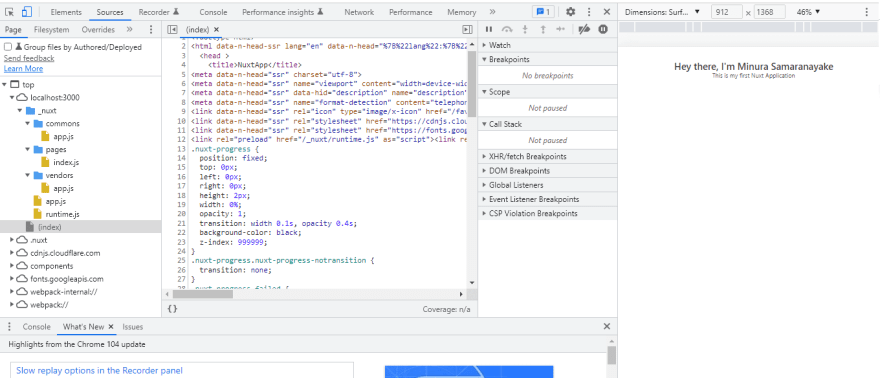
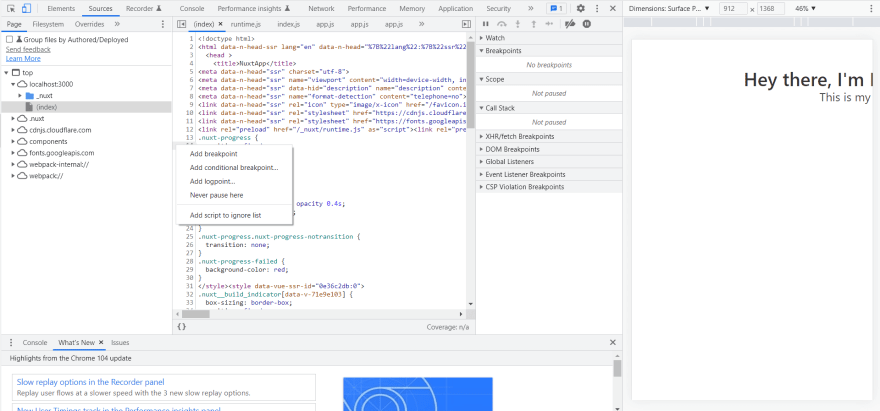
- Right-click on the line where you want to add the breakpoint. Then, in the dropdown list, select Add breakpoint.
 A blue color breakpoint will be displayed, as shown in the following image.
 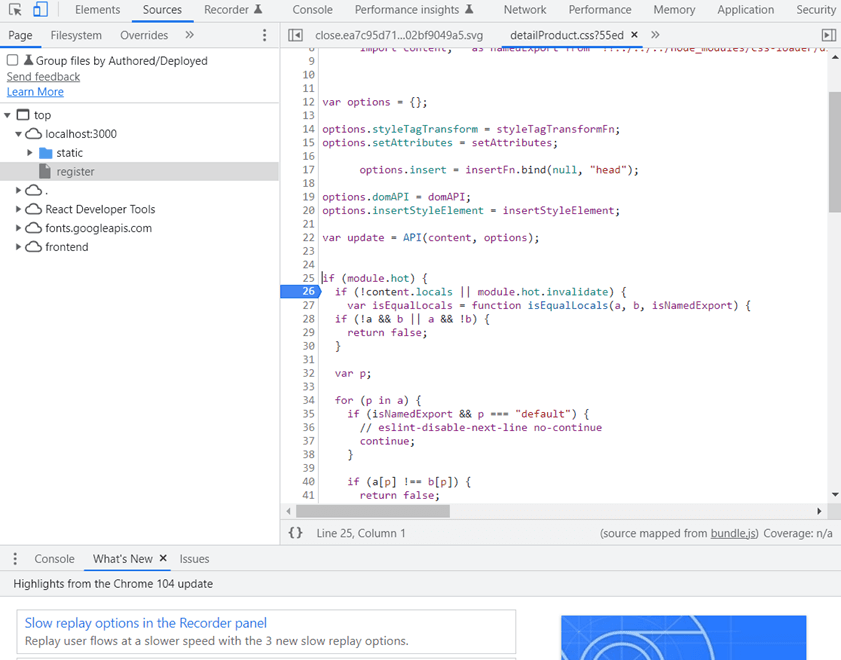 When we rerun the execution, the execution will pause at the breakpoint.
 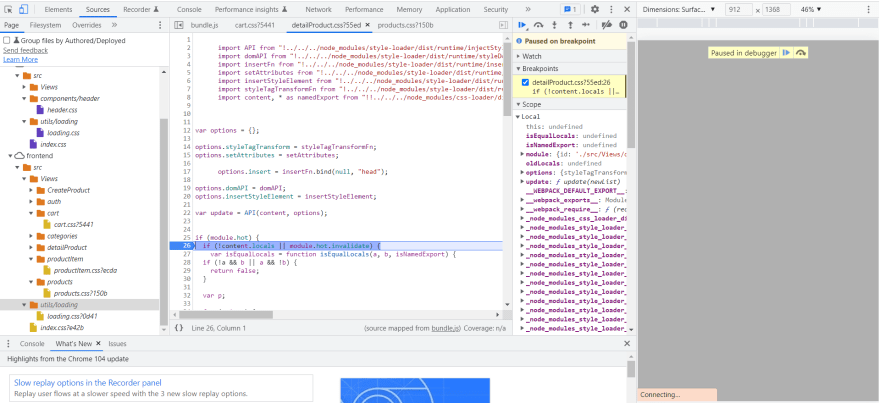 Instead of console.log(something) and reloading pages, pause and inspect the code. It’s a more productive way to debug. When everything appears in order, click the resume button on the page to proceed with the execution. DevTools allows you to add a variety of breakpoints.
The following image summarizes all the available breakpoint types.
Instead of console.log(something) and reloading pages, pause and inspect the code. It’s a more productive way to debug. When everything appears in order, click the resume button on the page to proceed with the execution. DevTools allows you to add a variety of breakpoints.
The following image summarizes all the available breakpoint types. 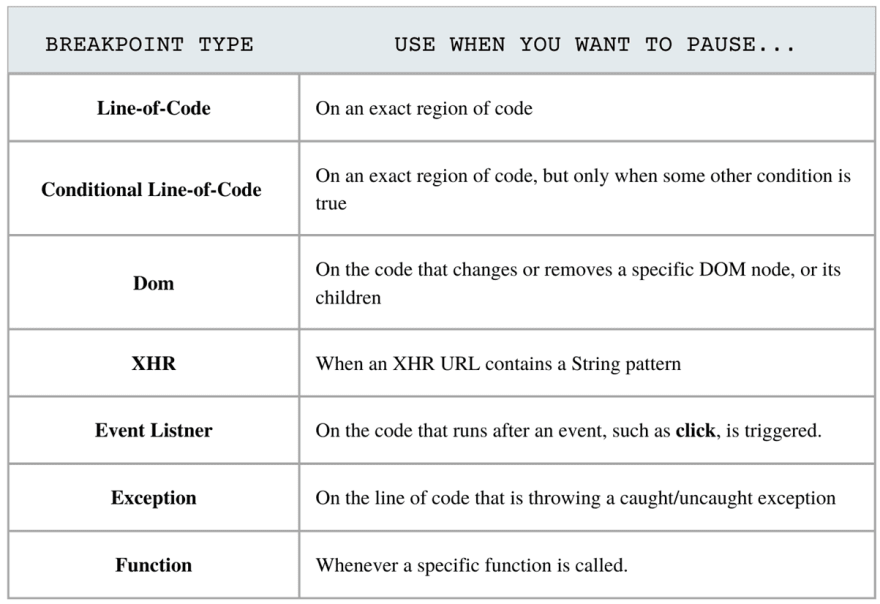
Create/Save/Run Snippets
Utilizing snippets is an additional effective method for debugging. Using snippets, you may quickly run and reuse scripts in any area of your app.
To add a snippet:
- Select Snippets in the left panel.
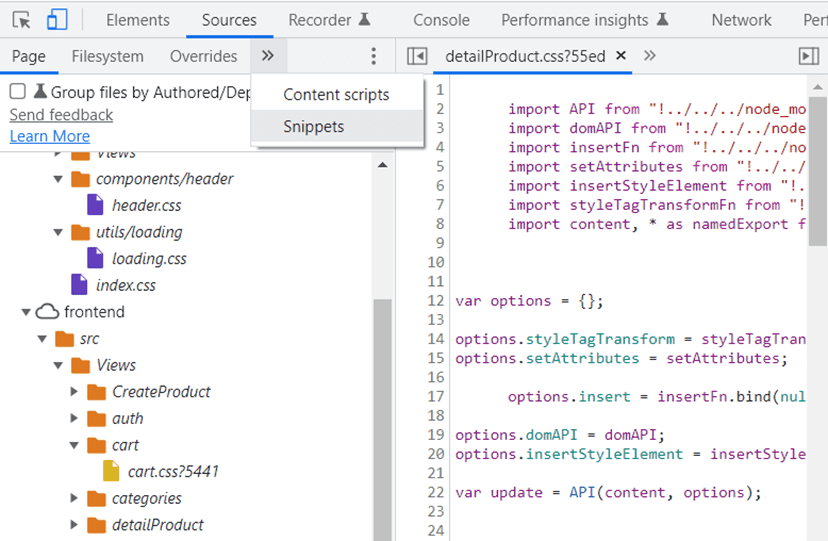
- Click *New Snippet * in the left panel and write your code in the middle panel.
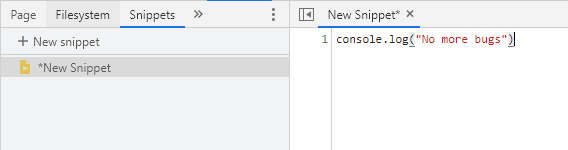
- Save your snippet with keyboard commands (CTRL+C on Windows).
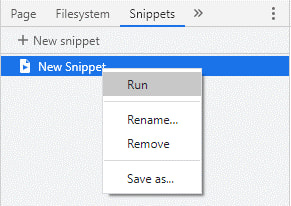
- To run this code, right-click on the snippet and select Run.
DevTools Call Stack
You can also use DevTools to view the call stack. This is helpful when you’re troubleshooting errors and you need to keep track of changes to the call stack due to many asynchronous methods. Expand the Call Stack panel in the right panel to examine all the current functions in the call stack. This is available in the Sources tab of the DevTools.

Changes to Variables
Suppose you have a bug that does not return the correct value for a variable, and you want to check its value at a specific point in a function:
- Add a breakpoint.
- Navigate to the appropriate panel.
- Expand the Scope to see the value of the variable.
You can see that this panel contains a lot of helpful information for troubleshooting bugs.
 You can edit the variables by double-clicking them to test the function with different values.
Blackboxing
At times, you might need to prevent some scripts from running while debugging. You can black box them in DevTools rather than commenting them out in your code. Click on the script file you want to ignore in the Sources tab’s left panel. To add a script to the ignore list, right-click the code in the middle panel and choose Add script to ignore list. 
Since the DevTools won’t execute this script, you can concentrate more on studying the flawed code and identifying the bug.
Benefits of Having a Debugger Tool
DevTools in Google Chrome is a terrific resource for debugging, enhancing network speed, viewing your site in various screen sizes and resolutions, and learning where you can improve the code. Even if Google Chrome is not your regular browser, installing it is highly recommended so you can use these features.
Saves time: The debugger helps enhance the speed of software development by providing many tools to keep track of the code and ensure the application’s behavior.
Reports errors: As soon as an error occurs, the debugger tool reports it. This makes the software development process less stressful and enables the early detection of errors.
Straightforward interpretations: By providing more details on data structures, the debugger tools enable simple interpretations.
Bug-free software: It assists developers in discovering software bugs so that they can be repaired before the software’s release.
Wrap Up
In this article, we went through the different techniques of debugging JavaScript code and the tools used in VS Code and Google Chrome.
VS Code’s debugging tools and Chrome’s DevTools offer significant functionality for debugging JavaScript. You’ll become a more effective debugger once you’ve mastered these tools and your days of unending console.log() will be over.
Thanks for reading. I hope this article helped with the critical concepts of debugging JavaScript.
Syncfusion’s Essential JS 2 is the only suite you will need to build an app. It contains over 65 high-performance, lightweight, modular, and responsive UI components in a single package. Download a free trial to evaluate it today.
If you have any questions or comments, you can contact us through our support forums, support portal, or feedback portal. We are always happy to assist you!

Top comments (0)