
TLDR: Exploring the user-friendly features of the new Syncfusion .NET MAUI TreeMap control and the steps to integrate it in a .NET MAUI application.
We are delighted to introduce another data visualization control in the Syncfusion .NET MAUI suite for the 2024 Volume 1 release, the all-new .NET MAUI TreeMap control.
The .NET MAUI TreeMap control visually represents hierarchical data using nested rectangles, sized and colored based on underlying values. It efficiently displays grouped and nested data structures, offering extensive customization options and supporting item selection.
In this blog, we’ll delve into the key features of the .NET MAUI TreeMap and outline the steps to get started!
Key features
The .NET MAUI TreeMap Control provides support for the following key features:
Let’s take a closer look at these features!
Data binding
The .NET MAUI TreeMap control seamlessly binds hierarchical data structures, visually representing the data into groups with leaf items as rectangles, providing precise data representation.
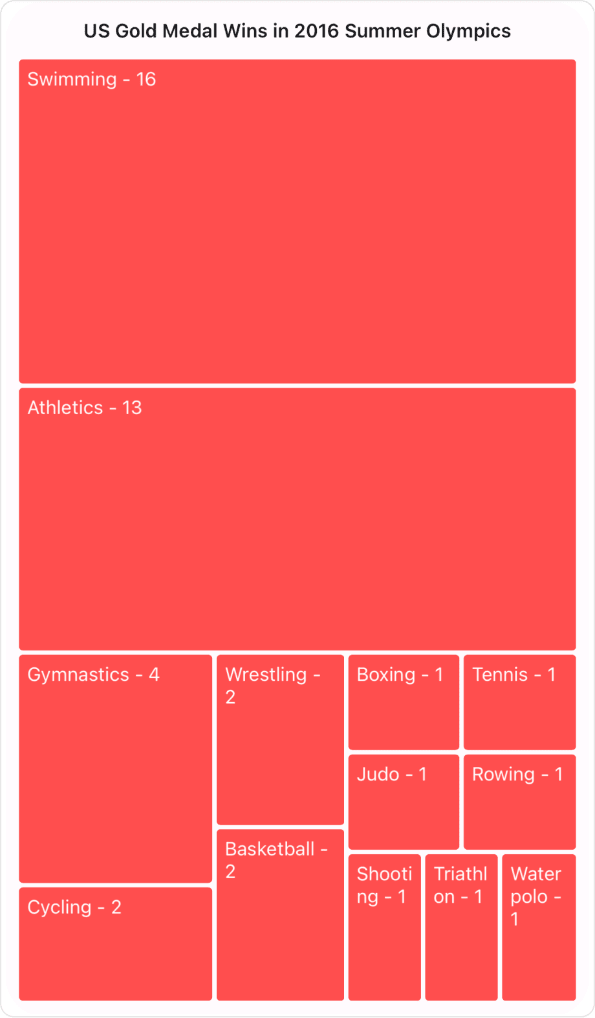
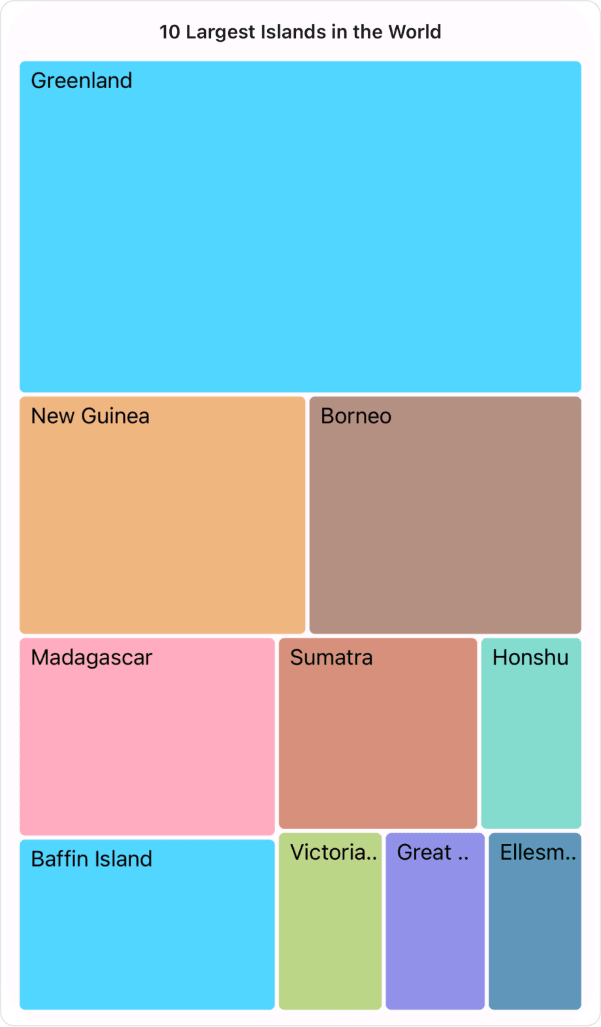
Layout types
The .NET MAUI TreeMap control offers multiple layout types to organize hierarchical data effectively. The layout types include squarified, slice and dice horizontal, slice and dice vertical, and slice and dice auto.
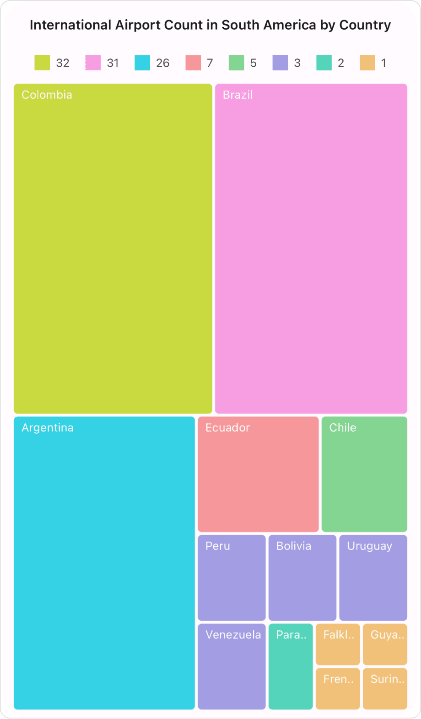

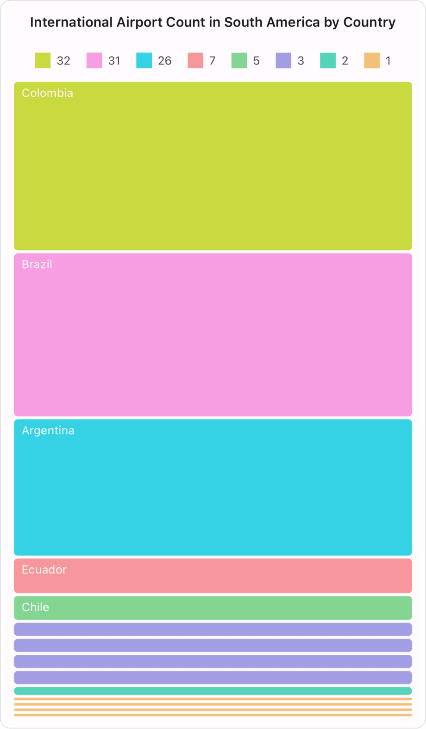
Different layout types in the .NET MAUI TreeMap control
Based on the high aspect ratio, the slice and dice auto layout visualizes the .NET MAUI TreeMap in long, thin rectangles vertically or horizontally.
Levels
The .NET MAUI TreeMap control seamlessly integrates multiple hierarchical data levels for richer and more detailed visualizations.

Legends
You can use legends to add additional information for interpreting a TreeMap with various colors, shapes, and more.

Tooltips
When the mouse hovers over items, the interactive TreeMap displays the details about the items’ values in tooltips.
Brush settings
Brush settings customize the fill colors for leaf items based on ranges or values. There are four brush settings available:
- UniformBrushSettings,
- RangeBrushSettings,
- DesaturationBrushSettings,
- PaletteBrushSettings.
Each setting provides unique options for defining and applying color schemes, enhancing the TreeMap visualization.

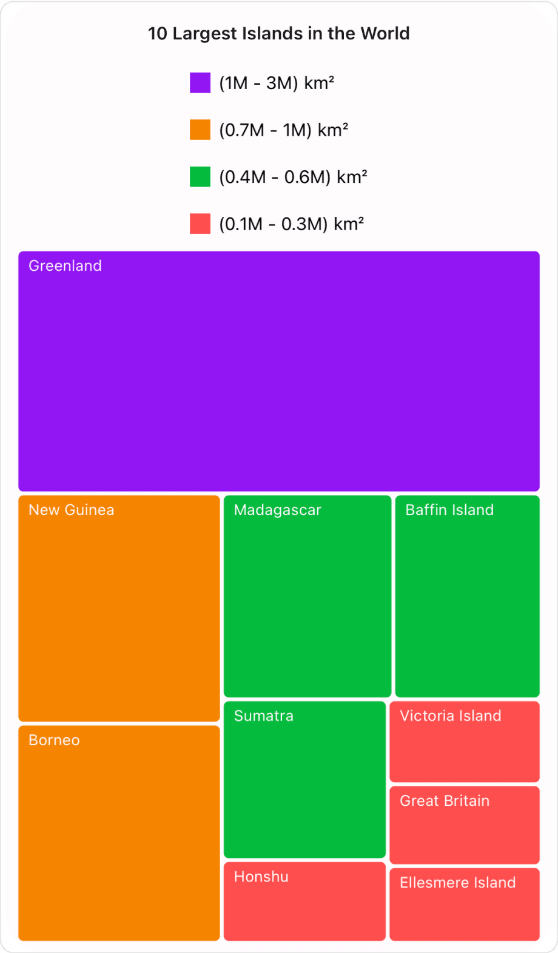

Different brush settings in the .NET MAUI TreeMap control
Selection
With the selection feature, you can distinguish specific groups or items, with tooltips providing additional information during interaction.
Appearance customization
The .NET MAUI TreeMap control allows users to customize the stroke color, stroke width, background color, selection color, data template, and more.

Note: For more details, refer to the .NET MAUI TreeMap documentation.
Getting started with the .NET MAUI TreeMap control
We have explored the key features of the .NET MAUI TreeMap control. Let’s see how to integrate the control in your .NET MAUI app.
Step 1: Create a new .NET MAUI app
Open Visual Studio and create a new .NET MAUI application.
Step 2: Add the required NuGet package
Syncfusion .NET MAUI components are available in the NuGet Gallery. To add the SfTreeMap to your project, open the NuGet package manager in Visual Studio and search for Syncfusion.Maui.TreeMap, and install it.
Step 3: Import and initialize the .NET MAUI TreeMap control
Now, add the Syncfusion.Maui.TreeMap namespace to your XAML page, and initialize the SfTreeMap control.
Refer to the following code example.
xmlns:treemap="clr-namespace:Syncfusion.Maui.TreeMap;assembly=Syncfusion.Maui.TreeMap"
<treemap:SfTreeMap />
Step 4: Register the Syncfusion core handler
Then, register the Syncfusion core handler in the MauiProgram.cs file.
using Syncfusion.Maui.Core.Hosting;
public static class MauiProgram
{
   public static MauiApp CreateMauiApp()
   {
       var builder = MauiApp.CreateBuilder();
       builder.ConfigureSyncfusionCore();
   }
}
Step 5: Populate the TreeMap data source
Let’s create a model class and view model data using the actual data. Then, bind the DataSource of TreeMap to the XAML page.
Creating a model class
public class PopulationDetails
{
    public string Country { get; set; }
    public string Continent { get; set; }
    public int Population { get; set; }
}
Create a view model data with the actual data
public class PopulationViewModel
{
    public PopulationViewModel()
    {
        this.PopulationDetails = new ObservableCollection<PopulationDetails>()
        {
            new PopulationDetails() { Continent ="North America", Country = "United States of America", Population = 339996564 },
            new PopulationDetails() { Continent ="South America", Country = "Brazil", Population = 216422446 },
            new PopulationDetails() { Continent ="North America", Country = "Mexico", Population = 128455567 },
            new PopulationDetails() { Continent ="South America", Country = "Colombia", Population = 52085168 },
            new PopulationDetails() { Continent ="South America", Country = "Argentina", Population = 45773884 },
            new PopulationDetails() { Continent ="North America", Country = "Canada", Population = 38781292 },
            new PopulationDetails() { Continent ="South America", Country = "Peru", Population = 34352719 },
            new PopulationDetails() { Continent ="South America", Country = "Venezuela", Population = 28838499 },
            new PopulationDetails() { Continent ="South America", Country = "Chile", Population = 19629590 },
            new PopulationDetails() { Continent ="South America", Country = "Ecuador", Population = 18190484 },
            new PopulationDetails() { Continent ="North America", Country = "Guatemala", Population = 18092026 },
            new PopulationDetails() { Continent ="South America", Country = "Bolivia", Population = 12388571 },
            new PopulationDetails() { Continent ="North America", Country = "Honduras", Population = 10593798 },
            new PopulationDetails() { Continent ="North America", Country = "Nicaragua", Population = 7046311 },
            new PopulationDetails() { Continent ="South America", Country = "Paraguay", Population = 6861524 },
            new PopulationDetails() { Continent ="North America", Country = "El Salvador", Population = 6364943 },
            new PopulationDetails() { Continent ="North America", Country = "Costa Rica", Population = 5212173 },
            new PopulationDetails() { Continent ="South America", Country = "Uruguay", Population = 3423109 },
        };
    }

    public ObservableCollection<PopulationDetails> PopulationDetails { get, set, }
}
Bind the DataSource of TreeMap
<treemap:SfTreeMap x:Name="treeMap"
                   DataSource="{Binding PopulationDetails}"
                   RangeColorValuePath="Population"
                   PrimaryValuePath="Population"
                   ShowToolTip="True">
 <treemap:SfTreeMap.BindingContext>
  <local:PopulationViewModel/>
 </treemap:SfTreeMap.BindingContext>
 <treemap:SfTreeMap.LeafItemSettings>
  <treemap:TreeMapLeafItemSettings LabelPath="Country">
  </treemap:TreeMapLeafItemSettings>
 </treemap:SfTreeMap.LeafItemSettings>
 <treemap:SfTreeMap.LeafItemBrushSettings>
  <treemap:TreeMapRangeBrushSettings>
   <treemap:TreeMapRangeBrushSettings.RangeBrushes>
    <treemap:TreeMapRangeBrush LegendLabel="50M - 1B"
                               From="50000000"
                               To="1000000000"
                               Brush ="#26A7C5" />
    <treemap:TreeMapRangeBrush LegendLabel="10M - 50M"
                               From="10000000"
                               To="50000000"
                               Brush ="#35D2E5" />
    <treemap:TreeMapRangeBrush LegendLabel="0.1M - 10M"
                               From="100000"
                               To="10000000"
                               Brush= "#65EFEF" />
   </treemap:TreeMapRangeBrushSettings.RangeBrushes>
  </treemap:TreeMapRangeBrushSettings>
 </treemap:SfTreeMap.LeafItemBrushSettings>
 <treemap:SfTreeMap.LegendSettings>
  <treemap:TreeMapLegendSettings ShowLegend="True"/>
 </treemap:SfTreeMap.LegendSettings>
 <treemap:SfTreeMap.ToolTipTemplate>
  <DataTemplate>
   <StackLayout Orientation="Vertical">
    <StackLayout Orientation="Horizontal">
     <Label Text="Country:"
            TextColor="White"
            Padding="5,0,0,0"
            FontSize="Caption"
            FontAttributes="Bold"/>
     <Label Text="{Binding Item.Country}"
            TextColor="White"
            FontSize="Caption"
            Padding="5,0,0,0"/>
    </StackLayout>
    <StackLayout Orientation="Horizontal"
                 Margin="0,3,0,0">
     <Label Text="Continent:"
            TextColor="White"
            Padding="5,0,0,0"
            FontSize="Caption"
            FontAttributes="Bold"/>
     <Label Text="{Binding Item.Continent}"
            TextColor="White"
            FontSize="Caption"
            Padding="5,0,0,0"/>
    </StackLayout>
    <StackLayout Orientation="Horizontal"
                 Margin="0,3,0,0">
     <Label Text="Population:"
            TextColor="White"
            FontSize="Caption"
            Padding="5,0,0,0"
            FontAttributes="Bold"/>
     <Label Text="{Binding Item.Population}"
            TextColor="White"
            FontSize="Caption"
            Padding="5,0,0,0"/>
    </StackLayout>
   </StackLayout>
  </DataTemplate>
 </treemap:SfTreeMap.ToolTipTemplate>
</treemap:SfTreeMap>
Now, you can run the application and visualize the specified data in the .NET MAUI TreeMap control.

References
For more details, refer to the .NET MAUI TreeMap control demo on GitHub and getting started documentation.
Conclusion
Thanks for reading! In this blog, we’ve explored the features of the new .NET MAUI TreeMap control introduced in the Essential Studio 2024 Volume 1 release. Check out our Release Notes and What’s New pages to see the other updates in this release, and leave your feedback in the comments section below.
For existing Syncfusion customers, the newest version of Essential Studio is available on the license and downloads page. If you are not a customer, try our 30-day free trial to check out these new features.
You can contact us through our support forums, feedback portal, or support portal. We are always happy to assist you!


Top comments (0)