
There will always be a requirement in a map component for a user to be able to view hospitals, hotels, restaurants, grocery stores, and other places. When viewing these on a world map or a country-specific map, there may be many places and markers scattered around the map, making the map appear cluttered.
The JavaScript Maps control is ideal for rendering maps from GeoJSON data or other map providers like OpenStreetMap and Bing Maps. Its rich feature set includes markers, labels, bubbles, navigation lines, legends, tooltips, zooming, panning, drilling down, and more.
Let’s discuss some effective ways to handle and showcase a huge number of markers using the Syncfusion JavaScript Maps control to avoid such congestion.
Note: To populate data on a map, refer to the documentation.
Zoom to a specific location beside the whole map
The zooming feature in the JavaScript Maps control lets us zoom in on maps to show in-depth information. During the initial rendering of a map, you can zoom either to a specific country on a world map or to a specific region on a country map to have a closer view.
To do so, first set the zoom factor, which zooms the map. Then, assign the center position to align the map’s exact latitude and longitude to the user view. In short, we set a custom position for the map.
Refer to the example on the StackBlitz on zooming to a specific location on the initial loading of a map.

You can also zoom to a specific position or coordinate at any time using the zoomByPosition and zoomToCoordinates built-in methods, respectively. The zoomByPosition method uses the center position’s latitude and longitude, as well as the zoom factor, to customize the position of the map. The zoomToCoordinates method takes the minimum and maximum latitude and longitude, that is, the top, left, bottom, and right portions of the map, to be brought into the viewport.
Zoom by position
Refer to the example on StackBlitz on zooming a map by position at runtime.

Zoom to coordinates
Refer to the example on StackBlitz for zooming to coordinates on a map at runtime.

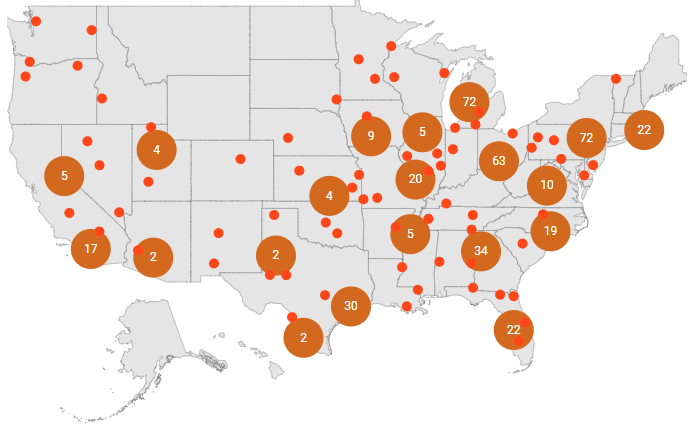
Marker cluster
We saw how to be choosy about which locations are displayed in the viewport. On the other hand, there are times when viewers want to see the entire world map or an entire country’s map at once, which is where a marker cluster comes in handy.
When there are many overlapping markers, we can group them using the marker cluster feature in JavaScript Maps. The number above the cluster represents the number of overlapped markers within it.
When we zoom in on any of the cluster locations, the number on the cluster decreases, and the individual markers appear on the map. When we zoom out of any of the cluster locations, the number of markers on the cluster increases, and the individual markers are added to the cluster.
You can also expand a marker cluster by clicking on it, which organizes and displays individual markers around the cluster.
Refer to the example for marker clustering on StackBlitz.
Note: For more details, refer to the Markers in JavaScript Maps documentation.
Conclusion
Thanks for reading! In this blog, we have seen how to handle and visualize a huge number of markers on a map effectively using the Syncfusion JavaScript Maps control. With this, you can elegantly visualize the places you want to locate on a map without any congestion. JavaScript Maps also supports other data visualization features like layers and legends. Try them and leave your feedback in the comments section below!
You can also enjoy these features in our Blazor, ASP.NET (Core, MVC, Web Forms), Angular, React, Vue, Flutter, UWP, WinForms, Xamarin, .NET MAUI, and WPF Maps controls.
For current customers, the new Essential Studio version is available for download from the License and Downloads page. If you are not yet a Syncfusion customer, you can try our 30-day free trial to check out our newest features.
For questions, you can contact us through our support forum, support portal, or feedback portal. We are always happy to assist you!

Latest comments (0)