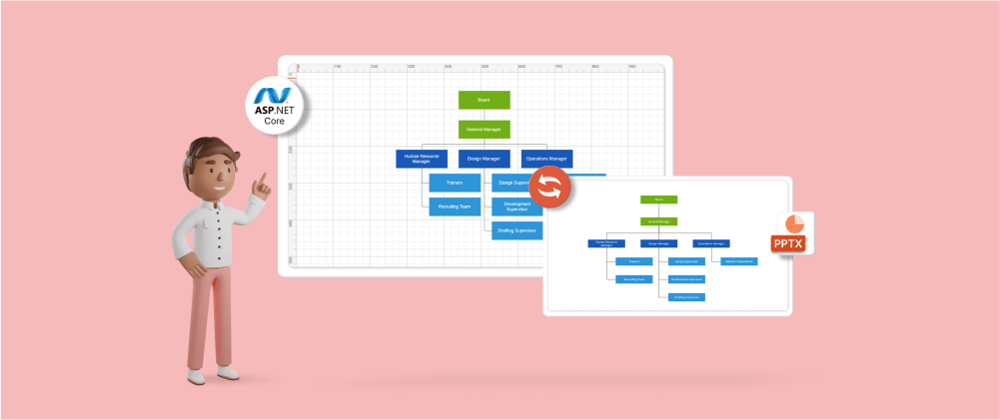
This blog explains how to convert an organizational chart created using Syncfusion’s ASP.NET Core Diagram component to a PPTX file using our .NET PowerPoint Library. The process involves creating an organizational chart, then sending the chart data to the server to generate the PowerPoint file.
Definitions
An organizational chart is a visual representation that illustrates the hierarchy, relationships, and relative ranks of positions within an organization. It provides a clear and concise overview of how various roles and responsibilities are distributed and interconnected.
The Syncfusion ASP.NET Core Diagram library provides tools and components that allow you to create, customize, and interact with organizational charts within your app.
PowerPoint is frequently employed in business settings to convey data, project updates, and reports during meetings. It provides a structured and visually appealing way to present information.
Create an ASP.NET Core application
First, create an ASP.NET Core app using this documentation.
Install Syncfusion Essential JS 2 libraries
Install the Syncfusion Essential JS 2 and Syncfusion Presentation packages in your ASP.NET Core app. You can do this via the NuGet Package Manager Console or Visual Studio’s NuGet Package Manager.
|
Package Name |
Description |
|
Syncfusion.EJ2.AspNet.Core |
This package provides the Syncfusion Essential JS 2 components for ASP.NET Core. With this, you can create an organizational chart using the Diagram library. |
|
Syncfusion.Presentation.Net.Core |
This package contains the Syncfusion PowerPoint Library for working with PowerPoint files and is used to generate PPT files. |
Include the required scripts and styles
In the _Layout.cshtml file, include the following necessary Syncfusion Essential JS 2 and CSS files.
_Layout.cshtml

@* Syncfusion Essential JS 2 Styles *@
<link rel="stylesheet" href="https://cdn.syncfusion.com/ej2/material.css" />

@* Syncfusion Essential JS 2 Scripts *@
<script src="https://cdn.syncfusion.com/ej2/dist/ej2.min.js"></script>
Create an empty diagram canvas
Next, create an empty diagram canvas in the ASP.NET Core app by defining an ejs-diagram tag with the width and height properties.
<ejs-diagram id="container" width="100%" height="700px">
   <e-diagram-rulersettings showRulers="true"></e-diagram-rulersettings>
</ejs-diagram>
Refer to the following image.

Define JSON data and OrganizationalDetails class
In the server-side code, create a C# class named OrganizationalDetails to represent the data for the organizational chart. This class has Id, Role, Color, Manager, ChartType, and Level properties. Additionally, define an action method named Index that retrieves the organizational chart data using the GetData() method from the OrganizationalDetails class. Then, set the chart data in the ViewBag to access it in the view.
public IActionResult Index()
{
     ViewBag.nodes = OrganizationalDetails.GetData();
     return View();
}

public class OrganizationalDetails
{
      public string Id { get; set; }
      public string Role { get; set; }
      public string Color { get; set; }
      public string Manager { get; set; }
      public string ChartType { get; set; }
      public string Level { get; set; }

      public OrganizationalDetails(string id, string role, string color, string manager, string chartType, string level)
      {
            this.Id = id;
            this.Role = role;
            this.Color = color;
            this.Manager = manager;
            this.ChartType = chartType;
            this.Level = level;
       }

       public static List<OrganizationalDetails> GetData()
       {
            List<OrganizationalDetails> organizationaldetails = new List<OrganizationalDetails>();
            organizationaldetails.Add(new OrganizationalDetails("parent", "Board", "#71AF17", "", "", "level1"));
            organizationaldetails.Add(new OrganizationalDetails("1", "General Manager", "#71AF17", "parent", "right", "level2"));
            organizationaldetails.Add(new OrganizationalDetails("2", "Human Resource Manager", "#1859B7", "1", "right", "level4"));
            organizationaldetails.Add(new OrganizationalDetails("3", "Trainers", "#2E95D8", "2", "", "level5"));
            organizationaldetails.Add(new OrganizationalDetails("4", "Recruiting Team", "#2E95D8", "2", "", "level5"));
            organizationaldetails.Add(new OrganizationalDetails("6", "Design Manager", "#1859B7", "1", "right", "level4"));
            organizationaldetails.Add(new OrganizationalDetails("7", "Design Supervisor", "#2E95D8", "6", "", "level5"));
            organizationaldetails.Add(new OrganizationalDetails("8", "Development Supervisor", "#2E95D8", "6", "", "level5"));
            organizationaldetails.Add(new OrganizationalDetails("9", "Drafting Supervisor", "#2E95D8", "6", "", "level5"));
            organizationaldetails.Add(new OrganizationalDetails("10", "Operations Manager", "#1859B7", "1", "right", "level4"));
            organizationaldetails.Add(new OrganizationalDetails("11", "Statistics Department", "#2E95D8", "10", "", "level5"));

            return organizationaldetails;
        }
}

<ejs-diagram id="container" width="100%" height="700px">
   <e-diagram-datasourcesettings id="Id" parentId="Manager" dataManager="new DataManager() { Data = (List<OrganizationalDetails>)ViewBag.Nodes }"></e-diagram-datasourcesettings>
   <e-diagram-layout type="OrganizationalChart"></e-diagram-layout>
</ejs-diagram>
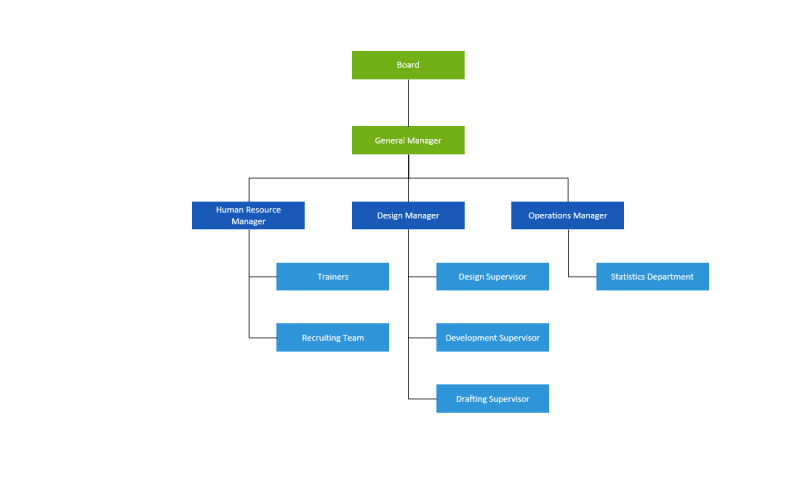
Customize the organizational chart
In the JavaScript section of the view, define the nodeDefaults , ConnectorDefaults , and getLayoutInfo functions to customize the appearance and layout of the nodes and connectors in the organizational chart.
public IActionResult Index()
{
    ViewBag.getConnectorDefaults = "ConnectorDefaults";
    ViewBag.getNodeDefaults = "nodeDefaults";
    ViewBag.GetLayoutInfo = "getLayoutInfo";
    return View();
}

<div class="control-section">
  <ejs-diagram id="container" width="100%" height="700px" getConnectorDefaults="@ViewBag.getConnectorDefaults" getNodeDefaults="@ViewBag.getNodeDefaults">
    <e-diagram-rulersettings showRulers="true"></e-diagram-rulersettings>
    <e-diagram-layout type="OrganizationalChart" getLayoutInfo="@ViewBag.GetLayoutInfo"></e-diagram-layout>
  </ejs-diagram>
</div>

<script>
  function nodeDefaults(obj, diagram) {
     obj.shape = {
         type: 'Text', content: obj.data.Role,
         margin: { left: 10, right: 10, top: 10, bottom: 10 }
     };
     obj.backgroundColor = obj.data.Color;
     obj.style = { fill: 'none', strokeColor: 'none', color: 'white' };
     obj.expandIcon = { height: 10, width: 10, shape: 'None', fill: 'lightgray', offset: { x: .5, y: 1 } };
     obj.expandIcon.verticalAlignment = 'Center';
     obj.expandIcon.margin = { left: 0, right: 0, top: 0, bottom: 0 };
     obj.collapseIcon.offset = { x: .5, y: 1 };
     obj.collapseIcon.verticalAlignment = 'Center';
     obj.collapseIcon.margin = { left: 0, right: 0, top: 0, bottom: 0 };
     obj.collapseIcon.height = 10;
     obj.collapseIcon.width = 10;
     obj.collapseIcon.shape = 'None';
     obj.collapseIcon.fill = 'lightgray';
     obj.width = 120;
     obj.height = 30;
     return obj;
  }

  function ConnectorDefaults(connector, diagram) {
      connector.targetDecorator.shape = 'None';
      connector.type = 'Orthogonal';
      connector.style.strokeColor = '#6d6d6d';
      connector.constraints = 0;
      connector.cornerRadius = 5;
      return connector;
  }

  function getLayoutInfo(node, options, orientation, type) {
     if (!options.hasSubTree) {
         options.type = 'Right';
     }
  }
</script>

Convert diagram to JSON using AJAX
In the JavaScript section of the view, design the convertDiagramToPPTX button by defining the function convertDiagramToJSON(), which will trigger when you click the convertDiagramToPPTX button. This function first retrieves the diagram data from the ejs-diagram instance, then iterates through the nodes and connectors to create a JSON representation of the chart. Finally, it will send the JSON data to the server using AJAX and posts it to the save action method in the controller.
<input type="button" value="convertDiagramToPPTX" onclick="convertDiagramToJSON()"/>

function convertDiagramToJSON() {
    var diagram = document.getElementById("container").ej2_instances[0];
    var nodePropertyCollection = [];
    var connectorPropertyCollection = [];
    //save the diagram.
    var saveData = diagram.saveDiagram();
    //parse the JSON string.
    var parsedData = JSON.parse(saveData);
    //iterate the nodes.
    for (var i = 0; i < parsedData.nodes.length; i++) {
        var node = parsedData.nodes[i];
        nodePropertyCollection.push({ id: node.id, width: node.width, height: node.height, offsetX: node.offsetX, offsetY: node.offsetY, shape: node.shape, annotations: [{ content: node.data.Role }], addInfo: node.data.Level });
    }
    //iterate the connectors.
    for (var j = 0; j < parsedData.connectors.length; j++) {
         var connector = parsedData.connectors[j];
         connectorPropertyCollection.push({ id: connector.id, sourceID: connector.sourceID, targetID: connector.targetID });
    }
    var jsonResult = { nodeProperty: nodePropertyCollection, connectorProperty: connectorPropertyCollection };
    var Jsonstring= JSON.stringify(jsonResult);
    //pass JSON string to the server via AJAX post.
    $.ajax({
        url: "/Home/save",
        type: "Post",
        contentType: 'application/json; charset=utf-8',
        dataType: 'json',
        data: Jsonstring,
        success: function (Jsonstring) {
           alert("Success");
           return true;
        },
    });
}
Generate the PowerPoint presentation on the server
In the controller, define the save action method, which receives the JSON data from the client via the AJAX post. The server-side code creates a PowerPoint presentation using the Syncfusion PowerPoint Library.
The save method iterates through the nodes and connectors in the received JSON data. For each node, it adds a corresponding shape to the PowerPoint slide and customizes its appearance based on the node’s properties. For each connector, it adds an elbow connector to the slide and connects the nodes based on the connector’s source and target IDs.
Finally, the server-side code saves the generated PowerPoint presentation as Diagram.pptx file and closes the presentation.
Refer to the following code example.
[HttpPost]
public ActionResult save([FromBody] Dictionary<string, object> NCProperty)
{
    //Create an instance for a PowerPoint presentation.
    IPresentation pptxDoc = Presentation.Create();
    //Add slide to the presentation.
    ISlide slide = pptxDoc.Slides.Add(SlideLayoutType.Blank);
    //Resize a slide size to diagram canvas size.
    slide.SlideSize.Width = 1000;
    slide.SlideSize.Height = 1000;

    //parse a node collection.
    List<DiagramNode> Nodes = JsonConvert.DeserializeObject<List<DiagramNode>>(NCProperty["nodeProperty"].ToString());
    foreach (var node in Nodes)
    {
        //Adds a new shape to the slide.
        IShape shape = slide.Shapes.AddShape(AutoShapeType.Rectangle, node.OffsetX, node.OffsetY, node.Width, node.Height);
        //Adds a shape id and its level.
        shape.Description = node.Id + "&" + node.AddInfo.ToString();

        // Apply the color for the shape.
        string hexColorCode = GetShapeColorBasedOnLevel(node.AddInfo.ToString());
        shape.Fill.FillType = FillType.Solid;
        shape.Fill.SolidFill.Color = ColorObject.FromArgb(int.Parse(hexColorCode.Substring(0, 2), NumberStyles.AllowHexSpecifier),
        int.Parse(hexColorCode.Substring(2, 2), NumberStyles.AllowHexSpecifier),
        int.Parse(hexColorCode.Substring(4, 2), NumberStyles.AllowHexSpecifier));

        // Disable the line format of shape.
        shape.LineFormat.Fill.FillType = FillType.None;

        // Apply VerticalAlignment.
        shape.TextBody.VerticalAlignment = VerticalAlignmentType.Middle;

        foreach (var annotation in node.Annotations)
        {
             //get the node label.
             string content = annotation.Content;
             //Adds a paragraph to the shape.
             IParagraph paragraph = shape.TextBody.AddParagraph();
             // Apply HorizontalAlignment.
             paragraph.HorizontalAlignment = HorizontalAlignmentType.Center;
             //Adds a text to the paragraph.
             ITextPart textPart = paragraph.AddTextPart(content);
             // Apply text properties.
             textPart.Font.Color = ColorObject.White;
             textPart.Font.FontSize = 10;
         }
     }
     //To get connectors collection.
     List<DiagramConnector> Connectors = JsonConvert.DeserializeObject<List<DiagramConnector>>(NCProperty["connectorProperty"].ToString());
     //Iterate a connectors.
     foreach (var connector in Connectors)
     {
          IShape sourceShape = GetShapeWithID(connector.SourceID, slide.Shapes);
          IShape targetShape = GetShapeWithID(connector.TargetID, slide.Shapes);
          if (sourceShape != null && targetShape != null)
          {
              int targetShapeConnectionPortIndex = GetConnectionPortIndexBasedOnLevel(targetShape.Description.Split('&')[1]);
              //Add elbow connector on the slide and connect the endpoints of the connector with specified port positions 0 and 4 of the source and target shapes.
              IConnector connectorShape = slide.Shapes.AddConnector(ConnectorType.Elbow, sourceShape, 2, targetShape, targetShapeConnectionPortIndex);
              //Adds a connector id.
              connectorShape.Description = connector.Id;
              //Apply connector line color.
              connectorShape.LineFormat.Fill.FillType = FillType.Solid;
              connectorShape.LineFormat.Fill.SolidFill.Color = ColorObject.Black;
           }
      }

      //Save the PowerPoint presentation.
      pptxDoc.Save("Diagram.pptx");
      //Closes the presentation.
      pptxDoc.Close();

      return null;
}

/// <summary>
/// Gets a shape object with corresponding shape ID.
/// </summary>
/// <param name="id">Represents the id of shape.</param>
/// <param name="shapes">Represents a shapes collection.</param>
/// <returns>Returns shape object with corresponding shape ID.</returns>
private IShape GetShapeWithID(string id, IShapes shapes)
{
     foreach (IShape shape in shapes)
     {
         if (shape.Description.Split('&')[0] == id)
             return shape;
     }
     return null;
}
/// <summary>
/// Gets a connection port index of the target shape based on its level.
/// </summary>
/// <param name="level">Represents a level of shape.</param>
/// <returns>Returns a connection port index of the target shape based on its level.</returns>
private int GetConnectionPortIndexBasedOnLevel(string level)
{
    switch (level)
    {
         case "level2":
         case "level4":
               return 0;

         case "level3":
               return 3;

         case "level5":
               default:
                 return 1;
     }
}
/// <summary>
/// Gets a shape color based on its level.
/// </summary>
/// <param name="level">Represent a level of shape.</param>
/// <returns>Returns a shape color based on its level.</returns>
private string GetShapeColorBasedOnLevel(string level)
{
    switch (level)
    {
       case "level1":
       case "level2":
       case "level3":
             return "71AF17";

       case "level4":
            return "1859B7";

       case "level5":
             default:
                return "2E95D8";
     }
}
GitHub reference
For more information, refer to the Convert organizational chart diagrams to PPTX GitHub demo.
Conclusion
Thanks for reading! In this blog, we’ve seen how to convert an organizational chart created using Syncfusion’s ASP.NET Core Diagram library to a PPTX file using Syncfusion’s PowerPoint Library. Try out the steps in this blog and provide your feedback in the comments section!
If you want to try the Diagram library, you can download our free trial. You can visit the Diagram control live demo and documentation for detailed explanations.
For questions, you can contact us through our support forum, support portal, or feedback portal. We are always happy to assist you!


Top comments (0)