
React is one of the most popular front-end frameworks today. Just like other frameworks, it has a set of tools for debugging called React Developer Tools (React DevTools). In this article, we’ll go through a few strategies that will help you debug React applications using the React Developer Tools.
What is React DevTools and how does it work?
React Developer Tools is a browser plugin that provides React-specific debugging features. It is available for Chrome, Firefox, and as a standalone app.
It displays the list of the root React components rendered on the page and the subcomponents that are rendered by each source. Ultimately, you can apply this data to find inefficient code or optimize data-intensive components.
Installation
If you are using a browser other than Chrome or Firefox, you can install the DevTools as a standalone app using the following command.
npm install -g react-devtools@^4`
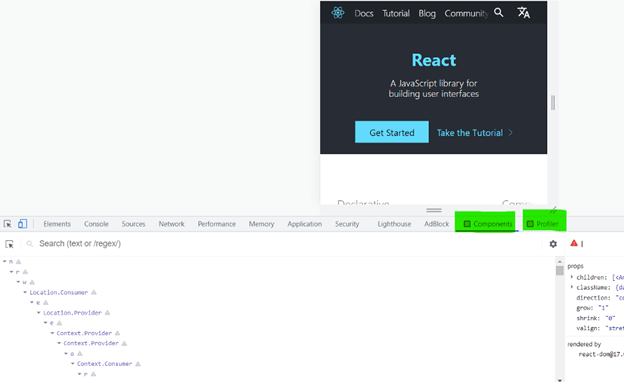
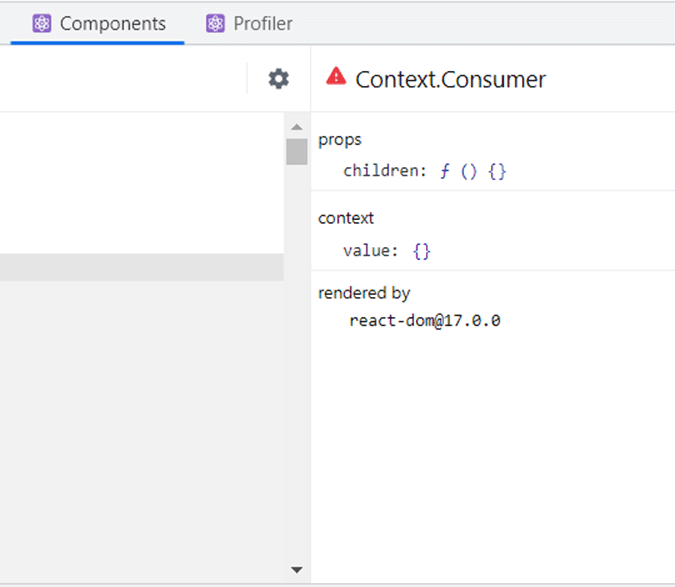
After installation, two new tabs, Components and Profiler , appear in the browser on inspecting the webpage in the browser. If you’re on a page without React components, both of these tabs appear gray. If it has React components, they will appear in blue or green.
Components tab
In prior versions, navigating through extensive component trees in DevTools was a little cumbersome. But now, there’s a Components tab, which displays the current React component tree and any props, states, or contexts. It also lets you filter components and hide those that you aren’t interested in.
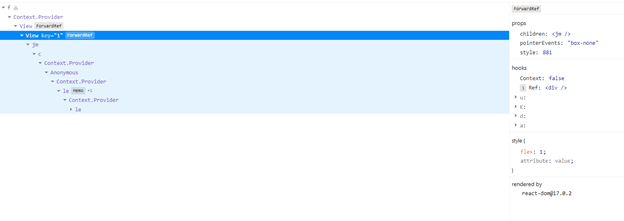
To view this functionality in action, choose a component and see the props, state, and hooks of that component displayed on the right-hand side of the console.
You can hover over any HTML element in the browser to highlight the React component responsible for rendering it. Or click on an HTML element to choose the relevant React component in the tree by selecting the arrow button in the leftmost tab.
DevTools adjusts nested indentation dynamically
In an earlier version of React DevTools, deeply nested components required both vertical and horizontal scrolling, making it challenging to track big component trees. DevTools now adjusts nested indentation dynamically to limit horizontal scrolling.
Restore the last element selected
When you hit Reload when debugging, DevTools restores the last chosen element to its original state.
Functions
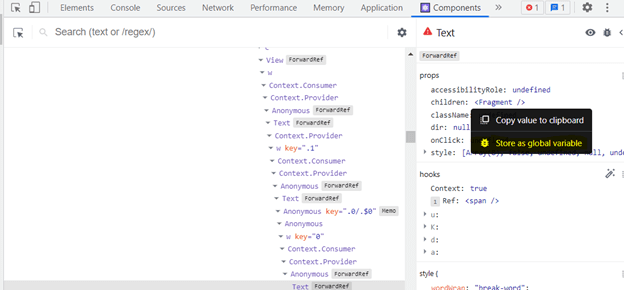
If you’re looking for a specific function, such as a click handler or a callback function, React DevTools has a handy option for you. You can make a function available as a global variable by right-clicking it in the props or state overview.
Improved support for hooks
Hooks now offer the same degree of support as props and states in version 4, making debugging React apps faster and easier. It’s possible to change values, drill down into arrays and objects, and so forth.
Profiler tab
The Profiler tab in React Developer Tools allows you to record interactions and measure component rendering. When you’re debugging something complicated, this feature comes in handy with a new “reload and profile” section.
It can keep track of component rendering and re-rendering, as well as the length of time each render takes. When assessing the performance of specific components, this list can be utilized to jump between commits easily.
Follow these steps to use the profiler:
- First, open a website that’s built with the profiling build of ReactDOM.
- Then, start recording a session by clicking the red circle.
- Perform some operations in the application.
- Finally, press the circle again to end the session. As a result, component-specific timings should appear.
A handy method to understand how components interact is by enabling a highlight when a component is re-rendered. This will offer you a visual representation of how the components react to data changes.
Step through parents
You can easily debug an unexpected prop value in the newest version of React DevTools by tracing back the origin of a particular prop.
The right pane displays a rendered-by option list that allows you to move across the list of owners to speed things up while debugging. We can see the parent component that renders each child component in our app by clicking on it.
React DevTools also has an inverse function known as the owners’ tree. It is a list of the items that a particular component renders. This can be an excellent approach to getting a feel for large, unfamiliar React apps.
Double-click a component to see the owners’ tree, then click the x button to return to the whole component tree. You can also navigate in the tree to see all children of the component.
Access components and states from the console
Although most bugs can be found and fixed easily with React DevTools, some debugging is better done via a good old console.log. Now you can interact with component instances directly from the console.
Open the console by selecting a component in React DevTools (hitting the escape key lets you see both at once). Then fetch the instance of that React component from the console by typing $r. 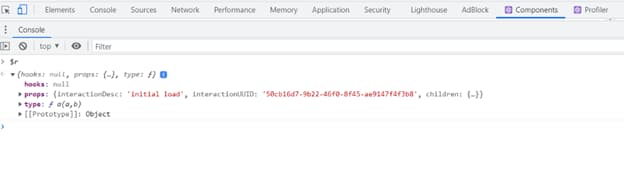
Jump into source view
Babel includes a plugin that adds the source property to all JSX elements. With this Babel plugin support, you can now directly navigate to the browser’s source view, where you can inspect, set breakpoints for, and modify the code. Although it slows down the application slightly, it does perform well in development mode.
Install babel-plugin-transform-react-jsx-source , add it to your .babelrc file. Then, restart your dev server to use this capability. You’ll notice a new option when you right-click a component in the component tree: Show component name> source.
Interaction tracking
Interaction tracking is supported by React DevTools. This is a programmatic API that allows you to label and track the performance of various events in your app. For example, button clicks. It would be helpful to trace these events to obtain timing information and underlying causes for some delayed commits.
Please do keep in mind that this API is removed with React 17.
Conclusion
Debugging is usually an interactive process in which you interrogate an application to understand why the behavior doesn’t match expectations. When debugging React, it is better to determine what you’re debugging first. Then, you can decide the techniques to use based on that.
I hope my article gave you a few insights into debugging React applications with React DevTools.
Thank you for reading!
The Syncfusion React JS suite offers over 70 high-performance, lightweight, modular, and responsive UI components in a single package. It’s the only suite you’ll ever need to construct a complete application.
For questions, you can contact us through our support forum, support portal, or feedback portal. We are always happy to assist you!

Top comments (0)