CircleCI introduced insights some time ago, but I wanted a timeline-like graph of all successful deployments and builds. Since the only way to graph builds is to view each branch, we'll need to do some querying and organizing. I've never used Recharts before, but it was relatively simple to use.
TLDR: Here's the GitHub repository.
Frontend
Since we're just wanting to get up and running, we can create a quick React project with npx create-react-app. After that, we'll have a bare React application and we can start looking into how we can gather metrics on our CircleCI builds and deployments.
Getting the Data
First, we need a script to grab both our deployment and build data. Luckily, CircleCI's API endpoints make that easy enough for us. I'll be using an open source project I'm contributing to currently.
Deployment Data
Let's create our first script for grabbing deployment data. We'll call this script get-deployment-data.js and slap it in our root directory.
const axios = require('axios');
const fs = require('fs').promises;

require('dotenv').config();

(async () => {
  const apiKey = process.argv[2] || process.env.CIRCLE_TOKEN;
  const vcsSlug = process.argv[3] || process.env.VCS_SLUG;
  const workflowName = process.argv[4] || process.env.DEPLOYMENT_WORKFLOW_NAME;

  const { data } = await axios.get(`https://circleci.com/api/v2/insights/${vcsSlug}/workflows/${workflowName}`, {
    headers: {
      'Circle-Token': `${apiKey}`,
      'Access-Control-Allow-Origin': '*',
    },
  });

  data.items = data.items.map(item => {
    const dtCreated = new Date(item.created_at);

    return {
      ...item,
      name: `${dtCreated.getMonth() + 1}/${dtCreated.getDate()}`,
    }
  });

  data.items.sort((a,b) => {
    const aDate = new Date(a.created_at);
    const bDate = new Date(b.created_at);

    return aDate > bDate || 0;
  })

  const jsonString = JSON.stringify(data.items);

  await fs.writeFile('./src/data/deployment-data.json', Buffer.from(jsonString, 'utf-8'));
})();
After using this script, it'll create a JSON file of the deployment data in the src/data directory:
node ./get-deployment-data.js abc123-def321-abcdef-123321 gh/sutt0n/test-repo deploy
Build Data
This one is a little tricky, because we can't simply query the workflow name, build for some reason. We have to obtain a select history of builds and grab the branch names returned from that. After we have the branch names, we can query the build workflow for a specific branch. Oh, and CircleCI's API has a rate limiter - so that's fun. We can add axios-retry and that should do the trick:
/**
* get-build-data.js
* Usage: node ./get-build-data.js <circle ci token> <vcs slug> <workflow name>
* Example: node ./get-build-data.js abc123-def321-abc-1234 gh/flexion/ef-cms hourly
* Returns: Creates ./data/build-data.json
**/

const axios = require('axios');
const axiosRetry = require('axios-retry');
const fs = require('fs').promises;

axiosRetry(axios, { retryDelay: axiosRetry.exponentialDelay, retries: 10 });

require('dotenv').config();

(async () => {
  const apiKey = process.argv[2] || process.env.CIRCLE_TOKEN;
  const vcsSlug = process.argv[3] || process.env.VCS_SLUG;

  const results = [];

  let offset = 0;

  for(let i = 0; i <= 3; i++) {
    offset += 100 * i;
    let { data } = await axios.get(`https://circleci.com/api/v1.1/project/${vcsSlug}?shallow=true&limit=100&offset=${offset}`, {
      headers: {
        'Circle-Token': `${apiKey}`,
        'Access-Control-Allow-Origin': '*',
      },
    });

    results.push(...data);
  }

  const branches = results.map(result => {
    if(result.workflows.workflow_name !== 'hourly' && result.lifecycle === 'finished') {
      return result.branch;
    }

    return null;
  }).filter((x,idx) => x && x.indexOf(x) === idx);

  const allResults = [];

  for(const branch of branches) {
    const {data} = await axios.get(`https://circleci.com/api/v2/insights/${vcsSlug}/workflows/build-and-deploy?branch=${branch}`, {
      headers: {
        'Circle-Token': `${apiKey}`,
        'Access-Control-Allow-Origin': '*',
      },
    });
    allResults.push(...data.items);
  }

  const jsonString = JSON.stringify(allResults);

  await fs.writeFile('./src/data/build-data.json', Buffer.from(jsonString, 'utf-8'));
})();
Charts
I decided the best approach was to graph out our credits and duration (in seconds) using the SimpleLineCart. Here's what our App.jsx looks like:
import './App.css';
import { LineChart, Line, XAxis, YAxis, CartesianGrid, Tooltip, Legend } from 'recharts';
import deploymentStats from './data/deployment-data.json'
import buildStats from './data/build-data.json'

function App() {
  return (
    <div className="App">
      <header>CircleCI Insights</header>
      <div className="insights">
        <h2 className="padding-top-0">Deployment Stats</h2>
        <LineChart
          width={1500}
          height={500}
          data={deploymentStats}
          margin={{
            top: 5,
            right: 30,
            left: 20,
            bottom: 5,
          }}
        >
          <CartesianGrid strokeDasharray="3 3" />
          <XAxis reversed dataKey="name" dy={5} minTickGap={75}/>
          <YAxis />
          <Tooltip />
          <Legend />
          <Line type="monotone" dataKey="credits_used" stroke="#8884d8" dy={30} />
          <Line type="monotone" dataKey="duration" stroke="#82ca9d" dy={30} activeDot={{ r: 3 }} />
        </LineChart>
      </div>
      <div className="insights">
        <h2 className="padding-top-0">Build Stats</h2>
        <LineChart
          width={1500}
          height={500}
          data={buildStats}
          margin={{
            top: 5,
            right: 30,
            left: 20,
            bottom: 5,
          }}
        >
          <CartesianGrid strokeDasharray="3 3" />
          <XAxis reversed dataKey="name" dy={5} minTickGap={75}/>
          <YAxis />
          <Tooltip />
          <Legend />
          <Line type="monotone" dataKey="credits_used" stroke="#8884d8" dy={30} />
          <Line type="monotone" dataKey="duration" stroke="#82ca9d" dy={30} activeDot={{ r: 3 }} />
        </LineChart>
      </div>
    </div>
  );
}

export default App;
Now let's run npm run start and we should see our deployment chart at the top:

Looks like we had a deployment that hanged (referring to the green spike). Thankfully it wasn't entirely synergistic with the credit usage.
Now, for our build chart. By filtering out the failed builds (including cancelled ones), we can get a better visualization on the relationship for our branch builds:
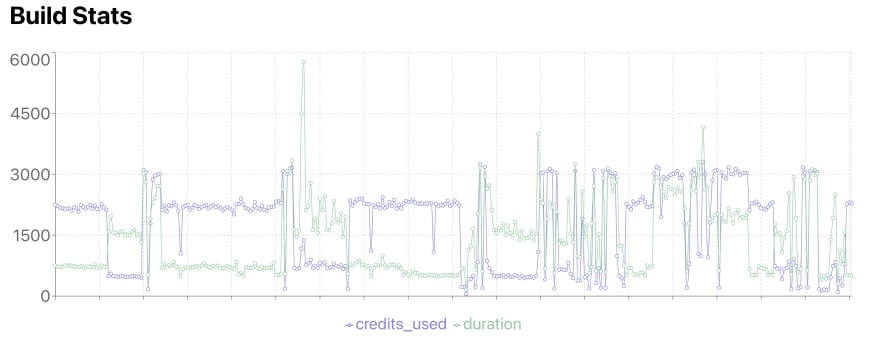
With the JSON returned, we can definitely get information back to that specific build to see what happened, and Recharts has an API event that allows us to click to get the data returned for a specific data point.
Thanks
I hope this helps you in better visualizing your credit usage with CircleCI! Thank you for reading, and please don't hesitate to ask questions or provide feedback in the comment section.


Top comments (0)