
CPRingChart is a customisable Swift library for creating ring hollow pie-charts quickly and with just a few lines of code. You can add it to your Swift project using Cocoapods.
The most widely used library for making these kind of charts, in my opinion, is probably the amazing 'Charts' library by Daniel Gindi (https://github.com/danielgindi/Charts). But unfortunately it does not provide the option to add rounded caps to your slices. Hence this library aims to solve that problem.
In this example, we will go through an example project for demonstrating the functionality of this library.
We will be using UIKit with Storyboards but you can also use it without Storyboards if you want.
So let's quickly setup the project.
- Open Xcode and create a new App.
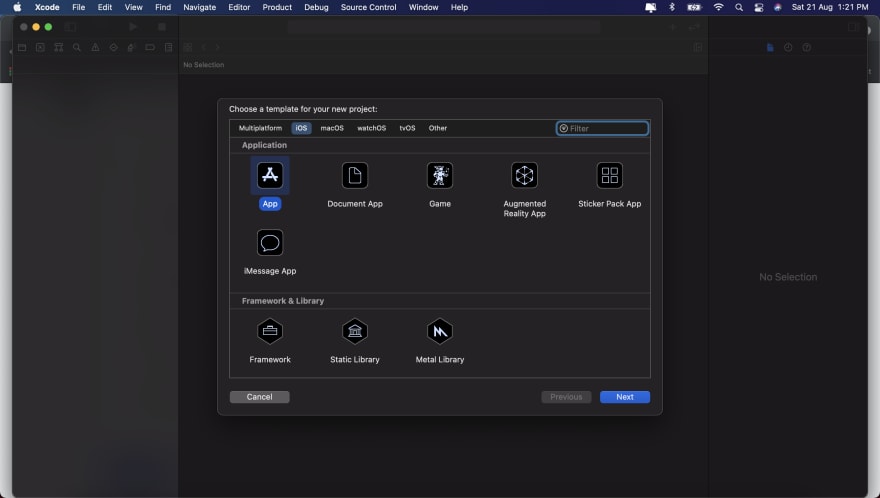
- I have named this project 'CPRingChartExample', but you can name your project anything you want. Select 'Storyboard' as the app's Interface, and select 'UIKit App Delegate' as the app's lifecycle. We will not be needing Core Data, so I will leave the checkbox next to 'Use Core Data' unchecked.

- Save the project where you can find it easily on your system. I have saved this project on my Desktop.
Cocoapods installation
Now that your project is created, close the Xcode project and open the Terminal window.
We will be using Cocoapods to install this library, so make sure you have Cocoapods installed on your system. If you don;t have Cocoapods installed on your system, just use this command to install Cocoapods.
$ sudo gem install cocoapods
If you would prefer to use other installation methods, then you can refer the Cocoapods documentation: https://guides.cocoapods.org/using/getting-started.html
- Next, in your Terminal window, navigate to your Xcode project folder's location using
cdcommand. I will be navigating using
$ cd Desktop/CPRingChartExample
- Now, initialise Cocoapods in your project using
$ pod init
- Open your Podfile & add the following line to it.
pod 'CPRingChart'
- Open Terminal, navigate to your project folder and run
$ pod install
Importing the Library & Usage
Now that we have CPRingChart added to our project, let's see how we can use it.
- Open the
.xcworkspacefile created in your Xcode project folder. OpenViewController.swift

- Replace all the existing code with the following in your
ViewController.swiftfile
//
//  ViewController.swift
//  CPRingChartExample
//
//  Created by Subhronil Saha on 21/08/21.
//

import UIKit
import CPRingChart

class ViewController: UIViewController {

    @IBOutlet weak var ringChart: CPRingChart!

    override func viewDidLoad() {
        super.viewDidLoad()

        // Ring chart setup here
        ringChart.sections = 5
        ringChart.values = [4, 5, 1, 2, 6]
        ringChart.fillColors = [.lightGray, .systemTeal, .systemOrange, .systemPurple, .systemPink]
        ringChart.reloadChart()

    }

}
I will be explaining this code below in Code Explanation section.
- Open
Main.storyboardand drop a UIView into the View Controller. Change its class toCPRingChart. Also link it to the outletringChartcreated earlier inViewController.swift.

- Run the Project. You should see this as the output.

Code Explanation
-
CPRingChart has a few mandatory properties that need to be set always. These are
-
sections- The number of sections/slices in the chart. -
values- ADoublearray containing the values for each section.- The length of
valuesshould be always equal tosections.
- The length of
-
fillColors- AnUIColorarray that specifies the color for each section.- The length of
fillColorsshould always be equal tosections.
- The length of
-
-
Other optional properties include the following:
-
spacing- The spacing between the sections.- Takes a
Doublevalue between 0 - 1. - Applies percentage relative spacing.
- Default value is 0.05 (ie 5%).
- Takes a
-
ringWidth- The width of the rings.- Default value is 10.
-
roundedCap- Boolean denoting if the ends are rounded or not.- Default value is
true.
- Default value is
-
centerFillColor- UIColor value representing the center fill color of the inner circle of the chart.- Default value is
UIColor.clear.
- Default value is
-
Once you are done making the changes you need to always call the method
reloadChart().
So that's it, you just created a ring chart in <10 lines of code! 😎 If you have any comments or suggestions regarding improvements in the library or other additional functionality, you can drop a comment here or email me at subhronilsaha99@gmail.com.
You can find the source code used in this article here:
https://github.com/subhronilsaha/CPRingChartExample
Thanks for reading.

Top comments (0)