
In 2023, monitoring is essential to modern DevOps teams' work. DevOps teams need reliable and flexible tools to effectively monitor and manage complex systems that can provide real-time insights into system performance, availability, and security.
Open-source monitoring tools have become increasingly popular due to their cost-effectiveness, flexibility, and community support.
Pros and Cons of OSS Monitoring Tools
Here are some advantages and disadvantages of open-source monitoring tools compared to SaaS tools.
Pros
- Customization: Open-source monitoring tools allow for greater customization and flexibility in terms of monitoring configurations and integration with other tools.
- Cost-effective: Open source tools are often free or low-cost, making them a cost-effective solution for organizations with limited budgets.
- Transparency: The code behind open-source monitoring tools is open for scrutiny and can be audited, providing greater transparency and accountability.
- Community support: Open-source monitoring tools are often supported by a large community of developers who provide support and contribute to the development of the tool.
Cons
- Complexity: Open source tools often require more technical expertise and effort to install, configure, and maintain than SaaS monitoring tools.
- Support: While community support is available, it may not always be sufficient for organizations with complex or specialized monitoring requirements.
- Security: Open source tools may be vulnerable to security breaches, as they may lack the robust security features and updates provided by SaaS tools.
- Scalability: Open-source monitoring tools may not be as scalable as SaaS tools, as they may require additional hardware and infrastructure to scale effectively.
Top 10 open-source monitoring tools
We will cover the following open-source monitoring tools that modern DevOps teams should be aware of in 2023:
- Sensu Go
- SigNoz
- Elastic APM
- Jaeger
- Prometheus
- Grafana
- OpenTelemetry
- Zabbix
- Healthchecks.io
- Percona Monitoring and Management (PMM)
These tools offer a range of monitoring capabilities, including collecting and analyzing metrics, monitoring logs, tracing requests, and alerting. Each has its strengths and weaknesses, and the best choice for a specific DevOps team will depend on their unique needs and requirements.
Sensu Go
Sensu Go is an open-source monitoring tool that allows you to monitor your infrastructure, including servers, containers, and cloud services. Sensu has 3 key points: Simple, Scalable, and Multi-cloud monitoring.

Sensu Go uses a decentralized architecture, where the monitoring checks are executed on client nodes called agents, and the results are sent to a backend server for processing and storage. This architecture allows for a more flexible and scalable monitoring setup, where you can add or remove agents as needed and distribute the monitoring workload across your infrastructure.
Sensu provides the Monitoring-as-Code functionality and automation that are essential for such dynamic environments ranging from completely automated deployment based on monitoring code templates (YAML configuration files), to flexible APIs to control all elements of the monitoring platform.
Sensu Go supports various types of monitoring checks, including Nagios-style checks, custom scripts, and plugins written in various languages. You can also use Sensu Go to monitor containerized environments such as Kubernetes and Docker, as well as cloud services such as AWS and GCP.
Pros
- Developers can code their own checks
- Easy configuration, scales well, and performance is good
- Message routing
- Nagios plugin compatibility
- Written in Go
Cons
- Not a very good UI
- Sensu Go has a learning curve, and it may take some time for users to become familiar with its functionality and configuration options.
SigNoz
SigNotz is an open-source APM (application performance monitoring) tool that you can use as an alternative to other tools like Datadog and NewRelic. It can come in very handy to monitor your applications and troubleshoot problems.
Furthermore, SigNoz integrates OpenTelemetry, supporting various languages and frameworks that implement it, like Java, Ruby, Python, Elixir, and much more. It supports various modern technologies and frameworks such as Kubernetes, Istio, Envoy, Kafka, gRPC, and more.

Top Features
- Monitor application metrics such as latency, requests per second, error rates.
- Monitor infrastructure metrics such as CPU utilization or memory usage.
- Track user requests across services.
- Set alerts on metrics.
- Find the root cause of the problem by going to the exact traces which are causing the problem.
- See detailed flame graphs of individual request traces.
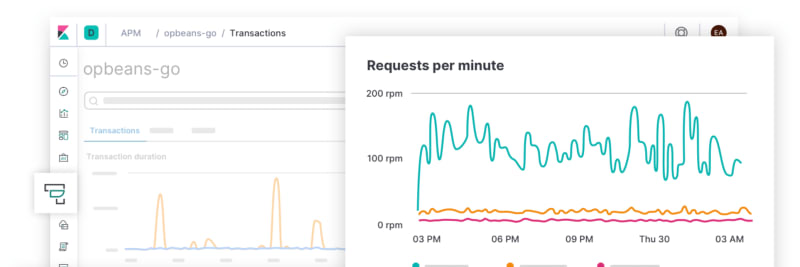
Elastic APM
Elastic APM (Application Performance Monitoring) is part of the Elastic Stack, a set of open-source data analytics and visualization tools. Elastic APM is designed to provide developers and DevOps teams with real-time insights into the performance of their applications.
Elastic APM supports many programming languages and frameworks, including Java, Python, Ruby, Node.js, and more. It can monitor application performance metrics such as response times, throughput, error rates, and resource utilization. It can also provide detailed transaction traces that allow developers to identify bottlenecks and performance issues in their code.
Top Features
- Elastic APM also automatically collects unhandled errors and exceptions. Errors are grouped based primarily on the stack trace so that you can identify new errors as they appear and keep an eye on how many times specific errors happen.
- Metrics indicate another vital source of information when debugging production systems.
- Elastic APM agents automatically pick up basic host-level metrics and agent-specific metrics, like JVM metrics in the Java Agent and Go runtime metrics in the Go Agent, alongside many other such agents.
Elastic APM Github repository →
Jaeger
Jaeger provides end-to-end distributed tracing, which enables users to track the flow of a request through a complex system and identify any performance bottlenecks or errors.
Jaeger supports various programming languages and frameworks, including Java, Python, Ruby, Go, and more. It can be integrated with popular web frameworks such as Spring Boot and Flask.

It can be used for monitoring microservices-based distributed systems:
- Distributed context propagation
- Distributed transaction monitoring
- Root cause analysis
- Service dependency analysis
- Performance/latency optimization
Pros
- Very easy to install
- Easy to configure with a datastore of your choice back end
- Open Source
- Feature Rich UI
- CNCF Project
What Jaeger lacks in maturity, it makes up for in speed and flexibility, and its newer, more dispersed parallel architecture. It’s also more performant and easier to scale. Jaeger has better official language support than its older rival, and you can also look at its CNCF support as a badge of approval.
Cons
Jaeger’s relative immaturity is a disadvantage. Jaeger’s choice of Go as its main language illustrates this point. Although the Gophers are extending their community fast, they are far from being as common as Java. If you’re not familiar with Go, this can make your learning process longer.
Another area that is both a blessing and a curse for Jaeger is its more modern architecture. This architecture offers benefits in terms of performance, reliability and scalability, but it’s also far more complex and harder to maintain.
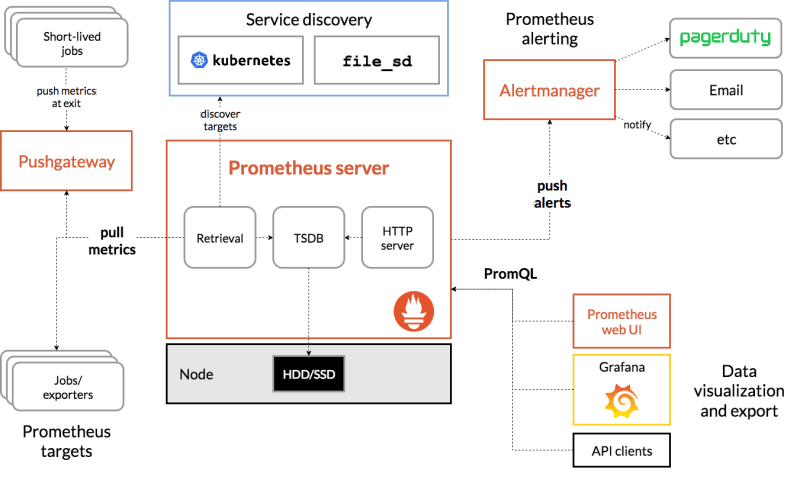
Prometheus
Prometheus is designed to monitor a wide range of metrics, including application performance metrics, server metrics, and network metrics. It uses a pull-based model to collect metrics from targets such as application servers, databases, and network devices. These metrics are then stored in a time-series database and can be visualized using the Prometheus web UI or integrated with third-party tools like Grafana.
Top Features
- Multi-dimensional data model
- Query language called PromQL to query the metrics data collected.
- Pull model data collection over HTTP.
- An alert manager to handle alerts
- Basic visualization layer but can be combined with Grafana to create rich visualizations.
Cons
Prometheus is a great metrics monitoring tool, but that's it. It is not a full-stack application monitoring tool like SigNoz:
- Prometheus only captures metrics. To create a robust monitoring framework, you will need to track metrics, logs, and traces. For example, a tool like SigNoz captures both metrics and traces(log management in product roadmap).
- Prometheus is designed for a single machine. It cannot be scaled horizontally.
Prometheus Github repository →
You can learn how to get started with Prometheus by reading our Practical Introduction to Prometheus Monitoring in 2023.
Grafana
Grafana provides a web-based user interface for creating and sharing custom dashboards, which can be used to display and monitor key performance indicators (KPIs) and other metrics. Grafana supports a wide range of visualization options, including charts, graphs, gauges, and tables, and can be used to create custom alerts based on metric thresholds.

One of the key strengths of Grafana is its support for a wide range of data sources, including popular time-series databases such as Prometheus, InfluxDB, and Graphite. It also supports log data sources like Elasticsearch and cloud providers like AWS and Azure.
Grafana includes a powerful query editor that enables users to filter, aggregate, and transform data in real-time. The query editor supports various query languages, including PromQL (used by Prometheus), InfluxQL (used by InfluxDB), and Elasticsearch queries.
Pros
- Easily integrate Prometheus and Graphite data sources.
- Many plugins are available for almost any storage array or operating system.
- Free and open-source. If you want more, get the pro or advanced plan.
- Highly customizable software. Customize alerts, data sources, dashboards, notifications, and more.
- Grafana is the king of data visualizations. It graphs metrics coming from any data source.
- Send alerts and notifications to collaboration channels.
Cons
- The highly customizable properties of Grafana make it challenging and time-consuming at the beginning.
- No data storage. If you also want to keep track of historical data, you’ll need a third-party storage solution.
- You’ll need to be skilled in programming languages like JSON and SQL to get the most out of Grafana.
OpenTelemetry
OpenTelemetry provides libraries for various programming languages and frameworks, including Java, Python, Go, and .NET. These libraries allow developers to instrument their applications with minimal effort, making it easier to collect telemetry data such as traces, metrics, and logs.
OpenTelemetry uses a vendor-neutral data model that allows telemetry data to be collected from multiple sources and exported to multiple destinations. This makes it easier to integrate with a wide range of observability tools and services.

Pros
- Reduces performance overhead on your application to generate and manage telemetry data
- Provides libraries and agents to auto-instrument popular libraries and frameworks requiring minimal changes to your codebase
- Provides OpenTelemetry Collector, which can receive, process, and export data in multiple formats
- Backed by technology giants like Google, Microsoft, and other big cloud vendors.
- Freedom to switch to new backend analysis tools by using relevant exporters
- Instrumentation support for new frameworks and technologies
Cons
- Project has a lot of scope in improving documentation and support
- It does not provide backend storage and a visualization layer
Zabbix
Zabbix uses a client-server architecture, where the Zabbix server collects data from multiple agents installed on network devices, servers, and applications. It can also collect data from other sources such as SNMP traps, JMX counters, and IPMI-enabled devices.
Zabbix supports a wide range of data collection methods, including simple checks like ping, HTTP, and SMTP checks, as well as more advanced checks like SNMP, JMX, and IPMI checks. It also supports custom checks, which can be used to monitor the performance of custom applications and services.

Pros
- Rich in features, a lot of possible Integrations, out-of-box templates and multi-tenancy support, powerful API, supports most monitoring protocols for networks, servers, services, applications, and IoT. Can monitor pretty much everything using standard protocols of custom scripts.
Cons
- Initial setup requires a lot of work, and a lot of optimization is needed in the long run. The documentation isn't so clear for first-timers, especially when common issues arise during installation or post-installation administration.
Healthchecks.io
Healthchecks.io is a service for monitoring cron jobs and similar periodic processes.
- Healthchecks.io listens for HTTP requests ("pings") from your cron jobs and scheduled tasks.
- It keeps silent as long as pings arrive on time.
- It raises an alert when a ping does not arrive on time.
Healthchecks.io is not the right tool for:
- monitoring website uptime by probing it with HTTP requests
- collecting application performance metrics
- log aggregation

Top Features
- Open source, can be self-hosted
- Simple, clean dashboard
- Team & API access
Pros
- The interface is extremely simple to set up, with clear instructions for implementation.
- Within 5 minutes, you can have notifications when your server fails to report and when the server returns online.
- At the end of the month, you'll have an email report with your downtime.
Cons
- The service lacks advanced analytics and other advanced features.
- Those seeking such features may not find it to be a good fit. However, I believe that the simplicity of this service is a bonus. Adding more features could potentially detract from the excellent user experience.
Healthchecks.io Github repository →
Percona Monitoring and Management (PMM)
Percona Monitoring and Management (PMM) is an open-source platform for managing and monitoring the performance of databases. Percona Monitoring and Management can be used to monitor a wide range of open-source database environments:
- Amazon RDS MySQL
- Amazon Aurora MySQL
- MySQL
- MongoDB
- Percona XtraDB Cluster
- PostgreSQL
- ProxySQL

Top Features
- Monitor the health of your database infrastructure
- Explore new patterns in database behavior
- Manage and improve the performance of databases no matter where they are located
- Discover unknown-knowns of database performance
- Access control/Permissions
- Historical Trend Analysis
Pros
- Visibility of performance between cluster nodes.
- Easy to use, good interface
- Very in depth metrics for DB like Slow query log, performance schema
Cons
- Alerting system should be improved like the alert template.
- Does not support very large DBs efficiently.
Conclusion
Today's complex technological landscape requires flexible monitoring tools that are both robust and cost-effective. Open-source solutions, such as those presented above, offer a multitude of advantages, from transparency and customizability to cost-effectiveness and community support.
However, it's important to consider factors like system complexity, technical expertise, scalability, and budget when choosing the right tool for your DevOps team. Keep an eye on the latest developments and updates in these tools to ensure your team is equipped with the best resources for maintaining system performance, reliability, and security.
Choose wisely to empower your team with the information they need to make the best decisions and take effective actions.
StatusPal provides powerful incident communication & monitoring tools. You can do a bunch more than with your average status page! Check out our Monitoring & Automations features and see how your business might benefit from Statuspal.io.

Top comments (0)