
preview url : https://colombiatest-amxmtyotek.now.sh
Ok, so this one is actually a story about one of my work in as you know is kinda like upwork it's a freelancing site that you can get a lot of job from there so i will tell you a story of how i got this and how i finish this job
Getting the job
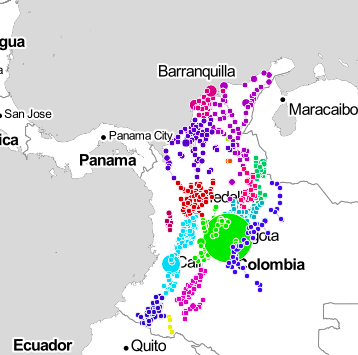
So long story short i got the job on freelancer from this dude from colombia he want to make a map that can show the data through csv it all working fine and all, but at some point of time the data doesn't connect to one another let me show you how the data looks like in the first place :
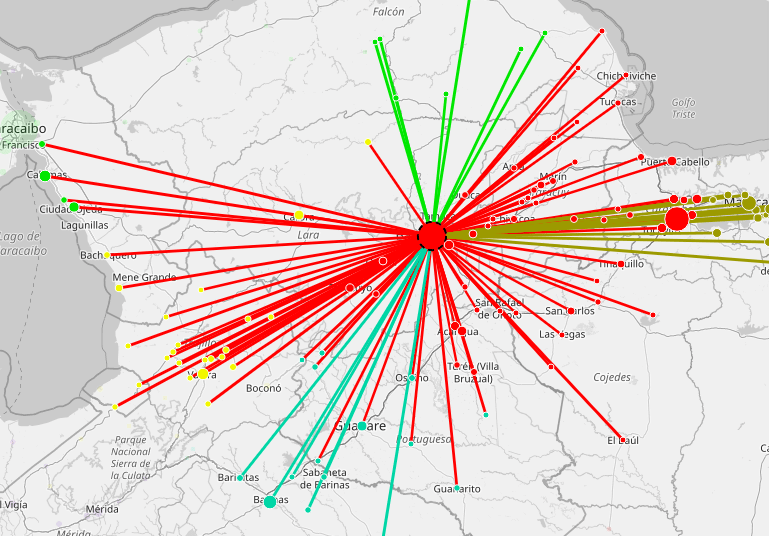
so it is working but my client want the data to be connected like the finish product that i show you in preview like this :
so i fix the javascript that load the csv and d3.js so it shown in the leaflet map coz turns out the graphic from d3.js doesn't show up because it is in the background of leaflet so this is the code that i use to fix it:
 //creating networks using jsnetworkx
                  G = new jsnx.Graph();
                  var nodes = [], links = [];
                  for(var k = 0; k < link_csvdata.length; k++){
                    links.push([link_csvdata[k].source, link_csvdata[k].target, {weight: link_csvdata[k].strength}]);
                  }
                  for(var k = 0; k < node_csvdata.length; k++){
                    nodes.push([node_csvdata[k].node, {weight: node_csvdata[k].weight}]);
                  }
                  G.addNodesFrom(nodes); G.addEdgesFrom(links);
                  G.addEdgesFrom(links);
                  // var paths = jsnx.shortestPath(G, {source: "J6201", target: "J6130"});
                  // console.log(paths);

                  var graph_data = {
                    "neurons":  create_nodedata(node_csvdata),
                    "synapses": create_linkdata(link_csvdata, node_csvdata)
                  }
this is just a snippet of the code because this is not an opensource code so i can just show you some snippet and explain so what this does is it take some of the csv that i have about all of the coordinate where should the marker goes then connected it.
i think thats it for now if you want to know more you can always ask me here about d3.js please leave comment down below.

Latest comments (5)
I recommend writing how you have built this as a article.
yes bro in thats why in the tag i write unfinishedspiritbro1 that means the article still not done yet i will finish it up in a couple of week
Please use the dratf feature so it is not available to public.
i will finish this article right now dont worry
(commentspiritbro1english) create a map from dataset loaded from csv data and viewed using d3js