
Introduction
The respect and adoration around the D3 library can be attributed to its ability to build complex charts such as treemaps and edge bundling. When clients need one of those breathtaking charts built, more often they pick D3. Why is this the case? well, the library arsenals have essential tools to build both basic and complex charts.
First, we need to consider how the library works. D3 takes map data to visual marks. For example, when drawing a line chart, D3 will take an array of objects and map a line in a Scalable Vector Graphic (SVG). For complex charts like pie charts and stacked bar charts, the process that requires mapping visual marks is more complicated. To solve this problem D3 brings out D3 layouts.
D3 layout
D3 layouts are a collection of methods used to create specific charts. These methods by themselves do not output any visual element like lines. Contrarily, layout methods transform data into a more convenient form in the creation of a specific chart.
For example, when working with a pie chart, the d3.pie() layout method will take a normal javascript object and add properties like endAngle and startAngle.
//d3.pie Layout Transformation of Data
//input data
const data = [1, 1];

//pie layout method
const pieGenerator = d3.pie();

//transformation of data
const arcs = pieGenerator(data);

//output data
[
  {"data":  1, "value":  1, "index": 6, "startAngle": 6.050474740247008, "endAngle": 6.166830023713296, "padAngle": 0},
  {"data":  1, "value":  1, "index": 7, "startAngle": 6.166830023713296, "endAngle": 6.283185307179584, "padAngle": 0},
]
The output data is now suited for generating arcs which gives a pie chart. This transformation was specifically intended for arcs generation which is an effective illustration of the importance of layout methods in visualization.
Types of D3 layouts
D3 comes with a number of layouts to cater to various types of visualizations. For each complex chart, d3 usually has a layout method for transforming input data to fit the specific needs of a given chart. These charts make use of different elements such as rects, circles, and lines. Layout methods are aware of these specific needs for these output elements. The most common D3 layout methods include:
1. Tree layout - Handles visualization with tree-like structure.
2. Pack layout – Handles circle packing charts
3. Pie layout – Handle pie charts
4. Force layout - Handles network visualizations
5. Chord layout – Handles network flow charts
6. Stack layout -Handldles stacked area and bar charts
A close look at pack layout
I have picked this layout as an example of D3 layouts. The layout works with hierarchical data which is evident. The layout method helps transform data to fit the nesting of circles.
Pack chart
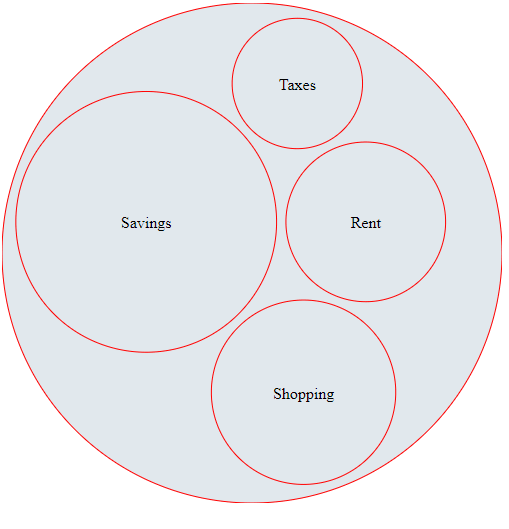
Input data
// Sample data for the bubble chart
        const data = {
            children: [
                { name: "Savings", value: 40000 },
                { name: "Rent", value: 15000 },
                { name: "Shopping", value: 20000 },
                { name: "Taxes", value: 10000 }
            ]
        };
Output data

Transformation of data
Passing data, which in our case has to go through d3.hierachy() to generate the root node. The pack(root) layout method returns objects with transformed data
 // Create a pack layout and set its size
        const pack = d3.pack()
            .size([500, 500])
            .padding(10);

        // Assign the data to the pack layout
        const root = d3.hierarchy(data)
            .sum(d => d.value);

        // Generate the pack layout and get the nodes
        const nodes = pack(root).descendants();
We use the d3.hierarchy to calculate the root node. The pack layout methods take a javascript object and add new attributes such as x, y, and r.
1. x - x coordinate for the circle's center
2. y - y coordinate for the circle's center
3. r - radius of the circle
This transformation allows the drawing of circle elements based on input data.
Conclusion
It is clear that D3 layout methods help in data transformation. They transform data to fit a specific type of visualization. These layout methods include d3.pie() and d3.pack(). Layout methods introduce new properties that help build custom charts, such as d3.pack() introducing radius property to draw packed circles.


Top comments (0)