
This article was originally posted on SigNoz Blog and is written by Vaishnavi Abirami.
Microservices logging is the practice of tracking and recording the activities of specific services in a distributed microservices architecture. Logging is an important aspect of any software system, and it is more critical for a microservices architecture as there are many small, independent services interacting with each other.
What are microservices?
Microservices architecture is a software design approach in which a large application is built as a collection of small, independent services. The goal of microservices architecture is to improve the scalability and maintainability of a software system by making it easier to develop, test, and deploy individual services independently.
One of the main benefits of microservices architecture is that it allows for a more granular and fine-grained approach to building and evolving a software system. This can make it easier to make changes to individual parts of the system without affecting the entire system.
Importance of Logging in Microservices
Logging is an important aspect of any software system. It is especially important in a microservices architecture, where there may be many different services running concurrently and interacting with each other.
In a microservices system, it is important to log events and errors at the service level so that it is possible to track and debug issues that may arise within a specific service. It is also important to have a centralized logging system that can collect and store log messages from all of the different services so that it is possible to get a holistic view of the system and identify patterns or trends that may not be apparent from looking at the logs of a single service.
The need for a Centralized Logging Service
A single centralized logging service that aggregates logs from all the services should be a preferred solution in a microservices architecture. In the software world, unique/unseen problems are not seldom, and we certainly do not want to be juggling through multiple log files or developed dashboards to get insights about what caused the same.
When one or more services fail, we need to know which service experienced an issue and why. It's also difficult to decipher the complete request flow in microservices. For instance, which services have been called? And in what sequence and frequency are that service called?
Here are a few microservices logging best practices:
Use an unique correlation ID per request
Imagine a situation where a large number of microservices produce millions of log entries every hour. If something odd happened, it would be challenging to identify the underlying cause. An invaluable tool in this kind of circumstance is a correlation ID. For each request sent to a server, a correlation request ID would be inserted. The identifier is passed back and forth between each service needed to fulfill the request. If you're trying to debug a problem, the first thing you should do is locate the special identification that was given along with the request. Even better would be to use the special ID when handling errors in the error log.Use Structured logging
Instead of logging unstructured messages, consider using a structured logging format such as JSON. This will make it easier to search and analyze your logs and will also make it easier to send your logs to a centralized logging solution. In the centralized location, you can make searches, such as those that seek logs with an "HTTP code" of 500 or higher. To provide your microservices logs with a consistent yet adaptable format, use structured logging.Add contextual data in your logs
Make sure to include enough context in your logs to be able to understand the events that lead up to an error or debugging issue. This might include information such as the request URL, request parameters, and user ID.Use Log Levels
Use different log levels (such as error, warning, and info) to indicate the severity of a log message. This will make it easier to filter your logs and understand the most important issues.Do not log sensitive data
Avoid logging personally identifiable information (PII). PII includes things like passwords, account numbers, and social security numbers. There is a privacy concern because it is possible that individual developers may need to examine logs for debugging needs. If your company wants to evaluate user behavior, take into account how certain types of sensitive data may be aggregated through logging to maintain user anonymity.Provide informative application logs
The log should have all the information required to understand the error when it occurs. We can troubleshoot more effectively and more quickly the more information that is accessible from the microservices logs.
At the very least, logs need to contain the following details:
- Service name
- UserID
- Hostname
- Correlation ID (can be in the form of traceid)
- RequestID
- Time Stamp
- Overall duration (at the end of a request)
- Method name
- Call stack (line number of the log)
- Request Method
- Request URI
Centralized logging solution
In a microservices architecture, it can be difficult to keep track of logs if they are scattered across multiple services. Using a centralized logging solution such as SigNoz or Elastic can help you to collect, query, and view logs from all your services in one place. Logs analytics tool like SigNoz provide dashboards to visually present logs data in an easily digestible format.Logging performance metrics
In addition to logging events and errors, consider also logging performance metrics such as response times and resource utilization. This will allow you to monitor the performance of your services and identify any potential issues.
Integrating Observability in logs
If the application logs contained request context identifiers (such as trace ids, span ids, traceflags or user-defined baggage based on w3c trace context recommendation) it would result in a much richer correlation between logs and traces, as well as correlation between logs emitted by different components of a distributed system. This would make logs significantly more valuable in distributed systems.
But before we go further, let’s have brief overview of what is observability.
What is observability?
We believe the aim of observability is to solve customer issues quickly. Creating monitoring dashboards is useless if it can’t help engineering teams quickly identify the root causes of performance issues.
A modern distributed software system has a lot of moving components. So while setting up monitoring, you might not know what answers you would need to solve an issue. And that’s where observability comes into the picture.
Observability enables application owners to get answers to any question that might arise while debugging application issues.
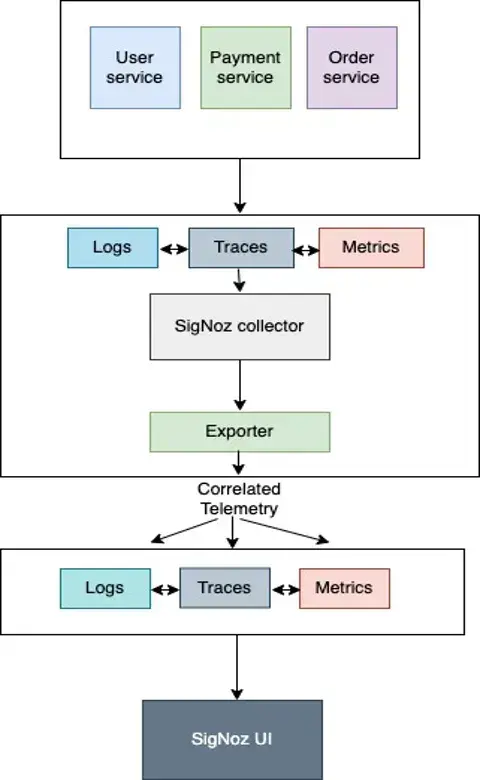
Logs, metrics, and traces as pillars of observability
Logs, metrics, and traces are commonly referred to as three pillars of observability. These three telemetry signals when correlated can drive application insights faster.
For robust observability, having a seamless way to correlate your telemetry signals is critical. For example, if you see that the latency of a particular service is high at the moment, can you deep-dive into relevant logs quickly? Can you correlate your metrics with traces to figure out where in the request journey the problem occurred?
Now the question is how do we generate, collect, and store telemetry signals so that they can be easily correlated and analyzed together. That’s where OpenTelemetry comes into the picture.
What is OpenTelemetry?
OpenTelemetry is a set of API, SDKs, libraries, and integrations aiming to standardize the generation, collection, and management of telemetry data(logs, metrics, and traces). OpenTelemetry is a Cloud Native Computing Foundation project created after the merger of OpenCensus(from Google) and OpenTracing(From Uber).
The data you collect with OpenTelemetry is vendor-agnostic and can be exported in many formats. Telemetry data has become critical to observe the state of distributed systems. With microservices and polyglot architectures, there was a need to have a global standard. OpenTelemetry aims to fill that space and is doing a great job at it thus far.
SigNoz is built to support OpenTelemetry natively.
We emit logs, traces, and metrics in a way that is compliant with OpenTelemetry data models, and send the data through SigNoz collector, where it can be enriched and processed uniformly.
OpenTelemetry defines a log data model. The purpose of the data model is to have a common understanding of what a LogRecord is, what data needs to be recorded, transferred, stored, and interpreted by a logging system. Newly designed logging systems are expected to emit logs according to OpenTelemetry’s log data model.
Now let’s look at a practical example of correlating logs with traces.
How do you add Context information in logs in a simple Go Application?
We have implemented the correlation of logs and traces in a sample Golang Application.
We instrument our Go application to generate traces in the way described in this documentation.
We will further check on how we add the context info in logs. We use zap library for logging.
In order to add the trace context information such as traceID, spanID and traceFlags in the logs, we have implemented a logger wrapper that records zap log messages as events on the existing span that must be passed in a context as a first argument. It does not add anything to the logs if the context does not contain a span.
Step 1: We do an initial set up of zap logger.
func SetupLog() {
    encoderCfg := zap.NewProductionEncoderConfig()
    encoderCfg.TimeKey = "time"
    encoderCfg.EncodeTime = zapcore.TimeEncoderOfLayout("2006-01-02T15:04:05")
    encoderCfg.MessageKey = "message"
    encoderCfg.CallerKey = zapcore.OmitKey

    fileEncoder := zapcore.NewJSONEncoder(encoderCfg)
    consoleEncoder := zapcore.NewConsoleEncoder(encoderCfg)

    logFile, _ := os.OpenFile("application.log", os.O_APPEND|os.O_CREATE|os.O_WRONLY, 0644)
    writer := zapcore.AddSync(logFile)
    defaultLogLevel := zapcore.DebugLevel
    core := zapcore.NewTee(
        zapcore.NewCore(fileEncoder, writer, defaultLogLevel),
        zapcore.NewCore(consoleEncoder, zapcore.AddSync(os.Stdout), defaultLogLevel),
    )
    logger = zap.New(core, zap.AddCaller(), zap.AddStacktrace(zapcore.ErrorLevel))
}
Step 2: Secondly, we wrap the zap logger and a context for use to add trace context information in the log messages.
type LoggerWithCtx struct {
    *zap.Logger
    context *context.Context
}

func Ctx(ctx context.Context) *LoggerWithCtx {
    return &LoggerWithCtx{
        Logger:  logger,
        context: &ctx,
    }
}

func (l *LoggerWithCtx) logFields(
    ctx context.Context, fields []zap.Field,
) []zap.Field {
    span := trace.SpanFromContext(ctx)
    if span.IsRecording() {
        context := span.SpanContext()
        spanField := zap.String("span_id", context.SpanID().String())
        traceField := zap.String("trace_id", context.TraceID().String())
        traceFlags := zap.Int("trace_flags", int(context.TraceFlags()))
        fields = append(fields, []zap.Field{spanField, traceField, traceFlags}...)
    }

    return fields
}

func (log *LoggerWithCtx) Info(msg string, fields ...zap.Field) {
    fieldsWithTraceCtx := log.logFields(*log.context, fields)
    log.Logger.Info(msg, fieldsWithTraceCtx...)
}
Step 3: The services which intends to use this log method needs to pass the request context object which adds trace_id, span_id and trace_flags field to structured log messages. This option is only useful with backends that don't support OTLP and instead parse log messages to extract structured information.
import log "github.com/vabira200/golang-instrumentation/logger"
log.Ctx(r.Context()).Info("Order controller called", metadata...)
Step 4: With the integration of wrapper with the zap library, this is how our logs look like(with traceid, spanid and traceflags). This follows the log data model from OpenTelemetry. For comparison, let’s look at logs with and without the integration of the wrapper.
Before Integration:
{

    "hostname": "baschidbs02-1-p.broadsoft.ims.comcast.net",

    "level": "info",

    "line": "order/order.go:48",

    "requestId": "42b2b58d-e9bb-482a-89cf-3a8ab3e3d027",

    "requestMethod": "POST",

    "message": "Successfully completed order request",

    "time":"2022-12-26T21:33:45",

    "requestPath": "/orders",

    "userAgent": "Mozilla/5.0 (Macintosh; Intel Mac OS X 10_15_7) AppleWebKit/537.36 (KHTML, like Gecko) Chrome/108.0.0.0 Safari/537.36",

    "userId": "4538"

}
After Integration:
{

    "hostname": "baschidbs02-1-p.broadsoft.ims.comcast.net",

    "level": "info",

    "line": "order/order.go:48",

    "requestId": "42b2b58d-e9bb-482a-89cf-3a8ab3e3d027",

    "requestMethod": "POST",

    "message": "Successfully completed order request",

    "time":"2022-12-26T21:33:45",

    "requestPath": "/orders",

    "spanid": "da0bace5360a7303",

    "traceid": "26a4a41da8170e6ee2bde8222056641b",

    "traceflags": 1,

    "userAgent": "Mozilla/5.0 (Macintosh; Intel Mac OS X 10_15_7) AppleWebKit/537.36 (KHTML, like Gecko) Chrome/108.0.0.0 Safari/537.36",

    "userId": "4538"

}
OpenTelemetry Log Collection with SigNoz
In this example, we will configure our application to write the logs to a log file. Then the SigNoz OpenTelemetry collector collects logs from the log file and exports them to clickhouselogsexporter which shows up the logs in the SigNoz UI.
Steps to collect Application Logs with OpenTelemetry
Clone the SigNoz github repository:
Start the signoz server following the instructions:

git clone -b main https://github.com/SigNoz/signoz.git
cd signoz/deploy/
./install.sh
Modify the docker-compose.yaml file present inside deploy/docker/clickhouse-setup by adding volumes for the application log file.
otel-collector:
    image: signoz/signoz-otel-collector:0.66.0
    command: ["--config=/etc/otel-collector-config.yaml"]
    user: root # required for reading docker container logs
    volumes:
      - ./otel-collector-config.yaml:/etc/otel-collector-config.yaml
      - /var/lib/docker/containers:/var/lib/docker/containers:ro
      - /<path_to_application_log_file>/application.log:/tmp/application.log
Add the filelog receivers in the otel-collector-config.yaml which is present inside deploy/docker/clickhouse-setup
receivers:
  filelog:
    include: ["/tmp/application.log"]
    start_at: beginning
    operators:
      - type: json_parser
        timestamp:
          parse_from: attributes.time
          layout: '%Y-%m-%dT%H:%M:%S'
      - type: move
        from: attributes.message
        to: body
      - type: remove
        field: attributes.time
Here we are collecting the logs and moving message from attributes to body using operators that are available. You can read more about operators here.
For more configurations that are available for filelog receiver please check here.
Next we will modify our pipeline inside otel-collector-config.yaml to include the receiver we have created above.
service:

....

logs:

receivers: [otlp, filelog]

processors: [batch]

exporters: [clickhouselogsexporter]
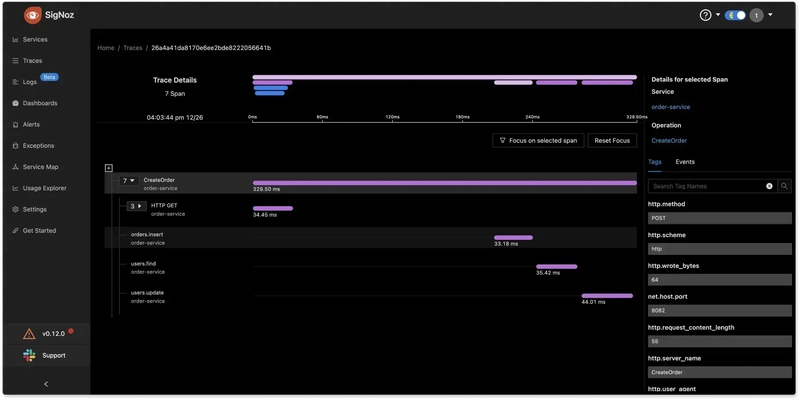
Now we can restart the OTel collector container so that new changes are applied, and the logs are read from the application log file. If you look at the traces tab, we can see the traces available with the traceID and span.
Now we need to switch to the logs tab and check for the equivalent log to the above trace.
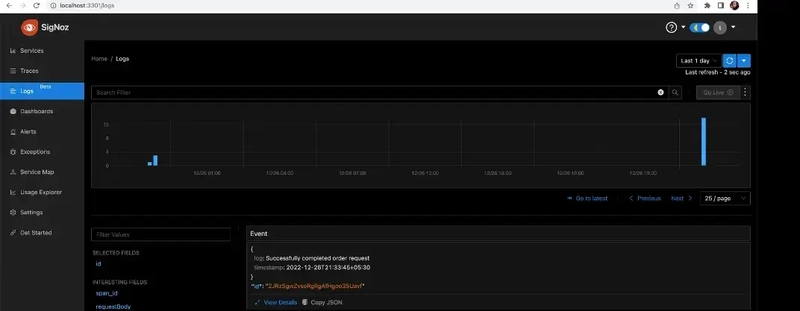
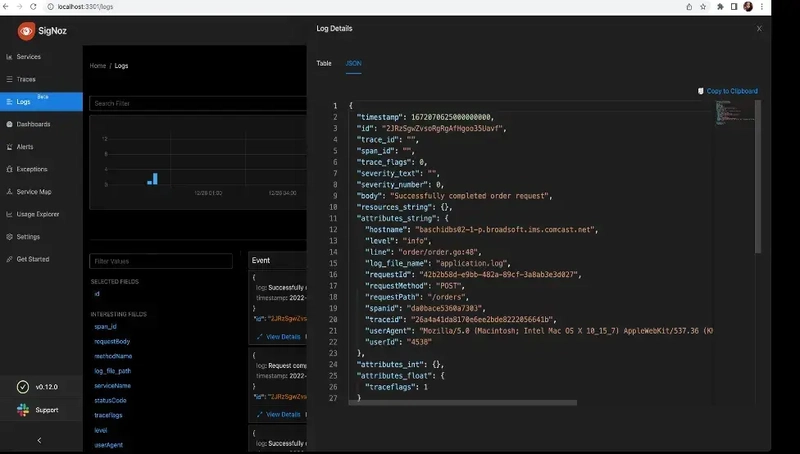
We can see the complete log of the above trace with traceid, spanid and traceflags.
Conclusion
It is a difficult task to handle logs at scale. A microservices architecture emits millions of log lines per minute. Having a structured approach to logging, adding observability to your software systems, and making it easy for developers to analyze and drive insights from logs data is key to having high-performing applications.
Having a unique logging model with centralized logging ensures that all developers use the same fields in their log messages. Furthermore, by enhancing our logs with contextual information like traceID, we can better correlate them with other telemetry signals.
When your code ditches you, logs become your best friend!
Related Posts

Latest comments (3)
Do you think request-level monitoring (i.e. storing request/response headers) for microservices is a valuable concept? We do that via a SaaS-based reverse proxy + on the fly reporting and a rules engine for routing
thank you for great article
You're welcome!