[

Introduction:
In the dynamic world of system design, where data is the new currency, mastering the art of logging metrics and automation is akin to charting a course through a complex network of information. It's about turning chaos into clarity. 🌐💡
As we embark on this journey through the realms of logging metrics and automation, picture yourself navigating a vast ocean of data. Each log entry acts as a navigational beacon, guiding you through the intricacies of system operations. From the subtleties of client-side interactions to the robust mechanics of server-side processes, every piece of data holds the key to understanding and optimizing your system. This guide serves as your map, revealing the pathways to effective and efficient system design.
1. Client-Side Logging: Capturing User Interactions
Client-side logging is a critical aspect of understanding user experience and identifying front-end issues. Tools like Sentry and LogRocket come into play here, offering insights into user interactions, JavaScript errors, and performance problems. Picture a scenario where a user encounters a bug - these tools capture this moment, providing not just an error log but also the context of the interaction, which is invaluable for debugging and enhancing user experience. 🖥️🔍
[

2. Server-Side Logging: The Backbone of Operations
At the core of your system's operations is server-side logging, where every transaction and interaction is recorded. Here, the ELK Stack (Elasticsearch, Logstash, Kibana) shines, offering a robust platform for monitoring server health and performance. This system acts like a control center, providing real-time insights into server operations, helping you to quickly identify and rectify issues. 🌐💻
[

3. Unified Log Management: Centralizing for Clarity
In the complex world of system design, unifying logs from client and server sides is crucial. This is where powerful tools like Splunk or Graylog come into play. They act as central hubs, collecting and consolidating logs from various sources, providing a comprehensive view of the system’s health. This unified approach simplifies monitoring and analysis, making it easier to pinpoint issues and understand system-wide patterns. 🌟📊
[

4. Alerting and Notifications: Staying Ahead of Issues
In the realm of logs and metrics, timely alerts are key. Integrating logging systems with communication platforms like Slack and Microsoft Teams via webhooks ensures that teams are promptly notified about anomalies or critical issues. This setup functions as an early warning system, enabling quick responses to maintain system integrity and performance. 🔔💬
Visual Suggestion: Diagrams or illustrations showing how alerts from logging systems are sent to communication platforms, highlighting the webhook mechanism.
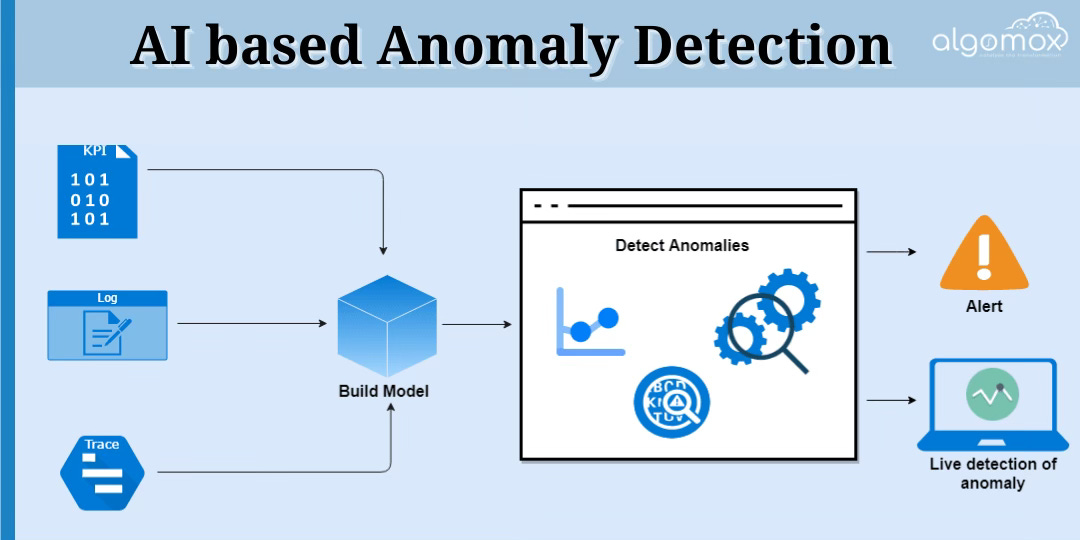
5. AI-Driven Log Analysis: The Next Frontier
Embrace the future with AI and machine learning in log analysis. Advanced tools within platforms like Sumo Logic and Splunk automate the process of sifting through logs, predicting potential issues, and even initiating proactive responses. This level of automation transforms raw data into actionable insights, paving the way for more resilient and efficient systems. 🤖📈
[

6. Security and Compliance in Logging
In the intricate world of system design, balancing the act of capturing essential information while maintaining data privacy and security is a tightrope walk. Modern logging tools are engineered to walk this line with precision. They are equipped with features to ensure that while logs capture comprehensive data for analysis and troubleshooting, they also adhere to stringent privacy and security standards.
For instance, consider GDPR compliance, which mandates strict handling of personal data. Modern tools like Splunk and Sumo Logic implement mechanisms to mask or anonymize personally identifiable information (PII) in logs. This ensures that sensitive user data, like IP addresses or user IDs, is either not logged at all or is transformed in such a way that it cannot be traced back to an individual, thus maintaining user privacy.
In addition, these tools offer encryption for logs both in transit and at rest. Encrypting logs while they are being transferred and stored further secures sensitive data from unauthorized access or breaches. This is crucial in industries dealing with highly sensitive information, such as finance or healthcare, where compliance with regulations like HIPAA for health data, or PCI DSS for financial data, is mandatory.
Moreover, modern logging tools provide fine-grained access controls. This means only authorized personnel have access to sensitive log data, and their activities can be audited to ensure compliance with internal and external regulations. Role-based access control (RBAC) is a common feature here, ensuring that users can only interact with log data pertinent to their role within the organization.
Furthermore, these tools often come with features for log integrity checks. This is vital in ensuring that the logs have not been tampered with, which is crucial for security auditing and complying with various regulatory requirements.
By implementing these features, modern logging tools provide a comprehensive solution for system designers and developers to responsibly handle logging, ensuring that they capture the necessary data for system monitoring and troubleshooting, while also respecting user privacy and adhering to security standards.
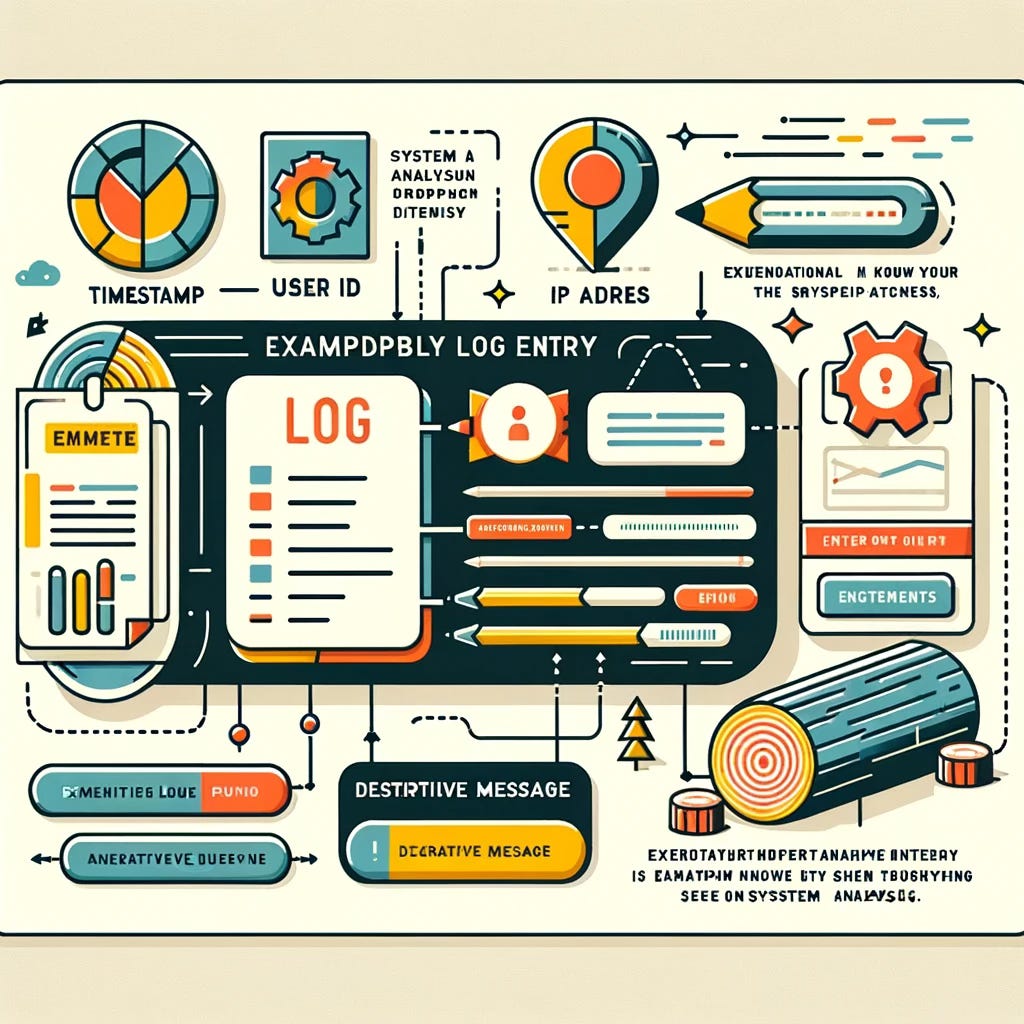
7. Effective Log Entries: Crafting Clarity and Precision
Creating effective log entries is akin to painting a detailed picture of your system's operation, where each stroke of information adds depth and understanding. The inclusion of crucial details like timestamps, user IDs, IP addresses, and clear, descriptive messages is what transforms a log from a mere data point into a valuable resource.
Consider a timestamp – it's not just a marker of when an event occurred; it's the backbone of log analysis. It allows you to track the sequence of events, understand patterns over time, and correlate data across different systems. In the realm of system troubleshooting, accurate timestamps are invaluable for pinpointing the exact moment a problem occurred.
User IDs and IP addresses add another layer to this picture. They provide context about who was involved in a particular event or where it originated. This information is crucial, especially in scenarios where security and user behavior need to be analyzed. For instance, in the case of a security breach, being able to quickly identify the source IP can be the key to mitigating further risks.
But what truly brings a log entry to life is a clear, descriptive message. This message should succinctly explain what happened, offering enough detail for a system administrator or developer to understand the event's nature without needing to dive into the code. For example, rather than a vague "Error 500," a descriptive message like "Error 500: Server unable to reach the database" provides immediate clarity.
Together, these elements form the essence of an effective log entry. They ensure that logs are not just collections of data but are insightful narratives that provide a clear understanding of system behavior, aid in rapid issue resolution, and improve overall system reliability.
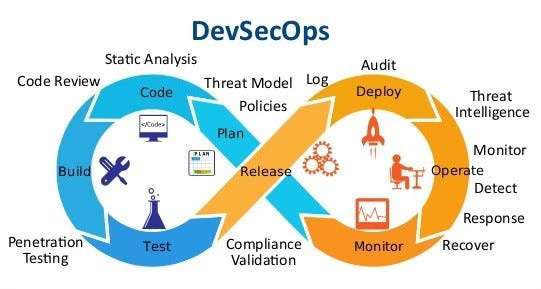
8. Seamless Integration with DevOps: Enhancing Monitoring and Response
The integration of logging with monitoring tools like Prometheus or New Relic plays a transformative role in the realm of system design. This integration isn't just about collecting data; it's about creating a dynamic ecosystem where logs and performance metrics inform each other, enhancing real-time monitoring and speeding up incident response.
Imagine your system as a living, breathing entity. Monitoring tools like Prometheus keep a constant pulse on this entity's health, tracking metrics such as CPU usage, memory consumption, and response times. When integrated with your logging system, these metrics are enriched with detailed context from logs. For instance, a spike in CPU usage can be immediately investigated by diving into logs that correlate with the time of the spike, providing insights into the cause, whether it's an inefficient code block or an external factor.
Similarly, New Relic offers real-time performance insights. By correlating these insights with logs, teams can quickly move from noticing an anomaly in performance metrics to understanding the underlying issues reflected in the logs. This rapid correlation speeds up the troubleshooting process, shifting from reactive to proactive incident management.
This synergy also feeds into agile development and operational efficiency. By continuously monitoring both system performance and logs, teams can identify and address potential issues before they escalate. This proactive approach aligns perfectly with the agile methodology, where continuous improvement is key. It ensures that the system remains robust, performant, and reliable, which is essential in today's fast-paced, uptime-critical digital landscape.
[

Conclusion: Empowering Your System Design with Strategic Logging and Automation
As we wrap up this journey through the landscape of logging metrics and automation, it's clear that these practices are not just a part of system design; they are at its very heart. By implementing the strategies and tools discussed, you empower your systems to be more resilient, efficient, and secure. 🌟
Remember, effective logging and automation are akin to having a sharp, clear lens through which the intricate workings of your system are viewed. Whether it's through client-side insights or server-side analytics, each log entry helps paint a fuller picture of your system's health and performance. 🎨🔍
I encourage you to embrace these practices, integrating them into your daily workflows. Use the insights gained from this guide to transform your logs from mere data points into powerful tools for decision-making and system optimization. 🚀
Let this guide be the starting point of your journey towards mastering logging metrics and automation. Explore, experiment, and continue to learn. The world of system design is constantly evolving, and staying ahead means being adaptable, knowledgeable, and always ready to innovate. 💡
📢 Ready to Take Your System Design to the Next Level?
Stay tuned for more insights and deep dives into the world of technology and system design. Follow, engage, and let's continue this journey of learning and growth together!
Remember, the knowledge and practices shared here are based on current industry standards and are ever-evolving. Keep exploring and staying updated with the latest trends and tools. 🌐
Reference List
For further reading and references used in the article, here's a list:
Sematext Blog: "Top 14 Logging Best Practices and Standards" [Sematext Blog]
Better Stack Community: "Logging Best Practices: 10 Dos and Don'ts" [Better Stack Community]
Synopsys Blog: "Top Seven Logging and Monitoring Best Practices" [Synopsys Blog]
Sumo Logic: "Log Management Best Practices for Modern Applications and Infrastructure" [Sumo Logic]
OWASP: "OWASP Recommended Event Attributes" [OWASP Cheatsheet Series]
Elasticsearch Official Documentation [Elasticsearch]
Fluentd Official Documentation [Fluentd]
Kibana Official Documentation [Kibana]
Splunk Documentation [Splunk]
Prometheus Official Documentation [Prometheus]
New Relic Documentation [New Relic]
Sentry Official Documentation [Sentry]
LogRocket Blog [LogRocket]
Graylog Official Documentation [Graylog]


Top comments (0)