
Introduction
The process of developing software always involves debugging, and JavaScript programmers frequently devote a lot of effort to doing so. A systematic approach is necessary for good debugging, and there are a number of best practises that developers may use to streamline the procedure. The recommended practises for debugging JavaScript code and typical traps to avoid will be covered in this blog post.
General Best Practices:
Start with a plan: Before you begin debugging, make sure you have a clear plan for what you want to achieve. Identify the problem you're trying to solve, and break it down into smaller, more manageable steps.
-
Reproduce the bug:
- In order to debug a bug, you need to be able to reproduce it consistently.
- Try to identify the conditions that cause the bug to occur, and replicate those conditions as closely as possible.
-
Check for syntax errors:
- Syntax errors are one of the most common causes of bugs in JavaScript code.
- Make sure your code is free of syntax errors before you begin debugging.
-
Use meaningful variable names:
- Using clear and descriptive variable names can make your code easier to understand and debug.
- Avoid using generic names like "x" or "y".
-
Keep your code organized:
- Well-organized code is easier to read and debug.
- Use proper indentation and formatting, and break your code into logical sections.
-
Stay calm and focused:
- Debugging can be frustrating, but it's important to stay calm and focused.
- Take breaks when you need to, and approach the problem with a clear and open mind.
Specific Techniques for Debugging JS Code:
--
A. Use console.log():
-
Console.log()is a simple and effective way to debug JavaScript code. - By placing
console.log()statements in your code, you can see the values of variables and functions at different points in the code execution. - This can help you identify bugs and understand the flow of the code.
B. Display objects as a table:
- Sometimes you want to view a complicated collection of objects.
- Either log them and browse the list, or use the
console.tablehelper. It makes it simpler to understand what you're up against!

C. Using the console.time() and console.timeEnd() benchmark functions:
- Knowing an item's precise execution time can be quite helpful, especially when troubleshooting slow loops. By giving the method a label, you can even create numerous timers. Let's examine its operation:

D. Get a function's stack trace.
- The Web console receives a stack trace through the
console.trace()method (MDN Reference).

- Output:

E. Use breakpoints:
- Breakpoints are a debugging tool that let you pause a piece of code from running at a particular place.
- This may help in finding problems and understanding the logic of the code.
- You may see the values of variables and functions at that time in the execution of the code by inserting breakpoints at strategic locations in the code.
F. Use conditional breakpoints:
- Conditional breakpoints are a particular kind of breakpoint that only causes the execution of the code to pause when a specific circumstance occurs.
- This can be useful in locating bugs that only appear under specific circumstances.
- You can reduce the scope of the bug and find the reason more quickly by utilising conditional breakpoints.
G. Use the debugger statement:
- The debugger statement is a simple way to pause the execution of code and launch the browser's developer tools.
- By placing the debugger statement in your code, you can inspect the values of variables and functions at that point in the execution.

H. Use a linter:
- A linter is a tool that analyzes your code and flags potential errors or issues.
- By using a linter, you can catch potential bugs before they become major issues.
- This can help you save time and improve the effectiveness of the debugging process.
- Let's take the scenario where we want to utilise a linter to search for unused variables. We may utilise a well-liked linter called ESLint by doing the following:
-
Install ESLint by running the following command in your terminal:
npm install eslint --save-dev
-
Create a new file called
.eslintrc.jsonin your project root directory, and add the following configuration:
Enter the following command in your terminal to launch ESLint:
npx eslint <file_name>.js
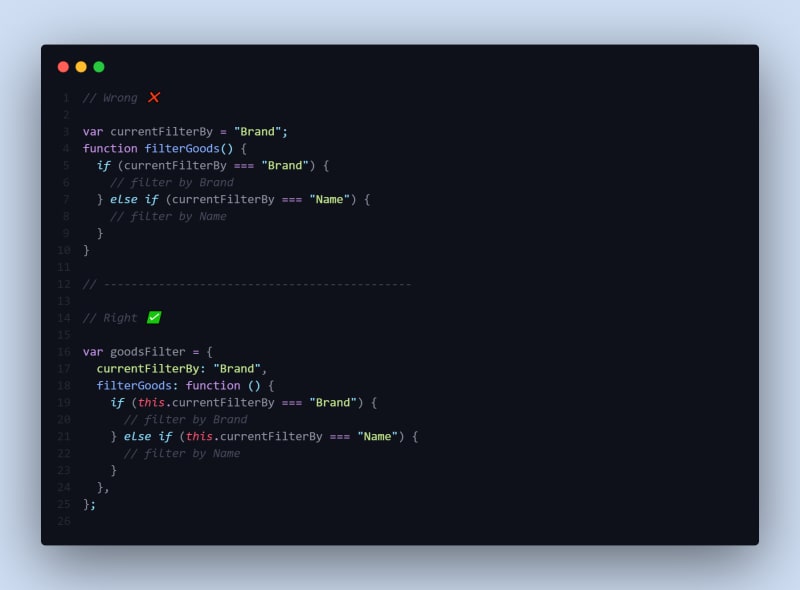
I. Avoid using global variables:
- Global variables can be difficult to debug, as they can be accessed from anywhere in your code.
- Global Variables can also lead to naming conflicts, code maintainability issues, and scope issues
- To make your code easier to debug, try to avoid using global variables whenever possible for more modular approach.
J. Understand scoping rules:
- JavaScript contains complex scoping restrictions that are occasionally challenging to figure out.
- By understanding how scoping works in JavaScript, you can avoid common scoping-related bugs and make your code easier to
debug.

K. Develop unit tests
- Automated tests called
unit testsare used to check the functionality of your code. - You can ensure that your code functions as intended and find errors before they reach the
productionenvironment by writing unit tests. You can create and execute unit tests for your JavaScript code using testing frameworks like
JestorMocha.-
Example:
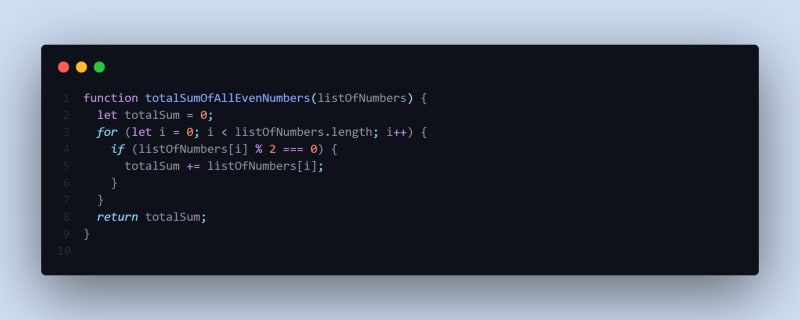
- Consider a
JavaScriptfunction that takes a number array as input and outputs the total of all the even integers in the array. The function's code is provided below:
- You might use a testing framework like
Jestto create a unit test case for this function. Here is a sample test scenario:

- Consider a
Other Best Practices:
--
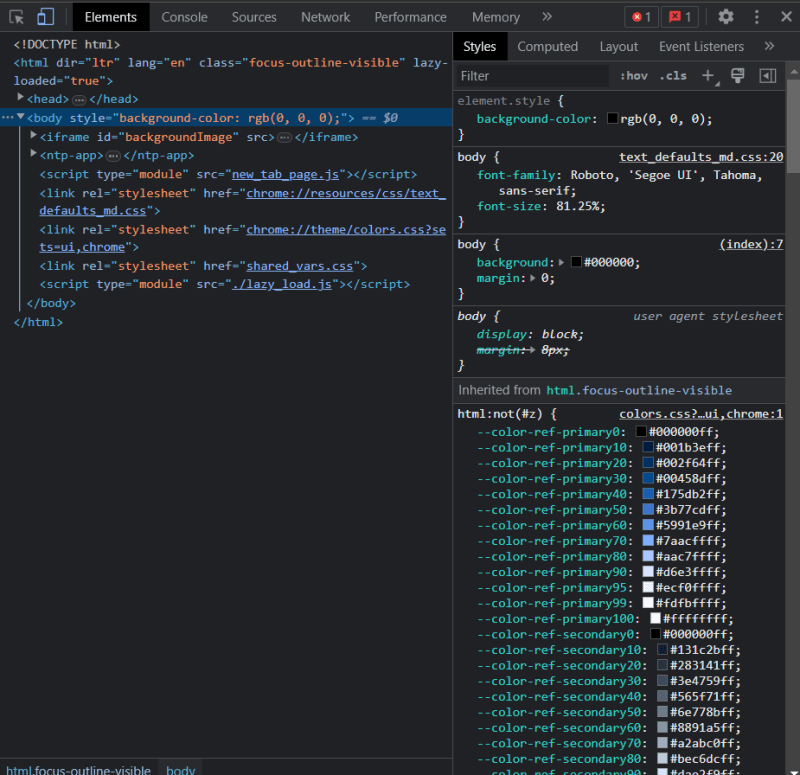
Use the browser's developer tools:
- The majority of modern browsers have robust developer tools that let you examine a web page's
HTML,CSS, andJavaScriptcode. - By utilising these tools, you can test your code across various devices and screen sizes and find and repair errors more quickly.
Write modular code:
- Modular code is a type of code that has been divided up into smaller, easier-to-maintain chunks.
You may more easily find and repair
errorsas well as reuse code across many projects by segmenting your code into smaller modules.Example:
utils.js file:

index.js file:

Document your code:
- Documenting your code can assist other developers working on the same project understand and troubleshoot it more easily.
- Documenting your code will help

Conclusion
In conclusion, successful debugging is a crucial step in the software development process, and you may improve the process by adhering to these recommended practises. You can find and fix bugs more quickly and effectively, producing more robust and reliable code, by using console.log() statements, understanding error messages, using breakpoints, testing your code incrementally, using a linter, avoiding global variables, using descriptive variable names, understanding scoping rules, and using a debugger.
Follow Shubham Dutta for more content like this.

Top comments (0)