Hi guys, this blog post is for clarifying and explaining some common machine learning and statistics concepts that can be very helpful to anyone new to the field of data science and machine learning.
Without further ado, let's get into it!
Some Basic Machine Learning Concepts
- Machine Learning model: A Machine Learning model is a program that can make predictions or decisions after being trained on a newly created dataset
- Training set: A training set is a subset to train a model
- Test set: A test set is a subset to test the trained model The training and test sets are two separate collections of data that are used to measure the accuracy of the Machine Learning model that you want to train
- DataFrame: DataFrame is a data structure that is part of the Pandas library
- Supervised machine learning: This type of machine learning is where some input data is provided to a mapping function in order to obtain a specific output
- Unsupervised machine learning: This type of machine learning is characterized by having no correct output for a provided input. Accordingly, no correct answer exists. The goal of this type of machine learning is to analyze data in its entirety and discover facts about the underlying structure
- Semi-Supervised learning: This type of machine learning is a combination of supervised and unsupervised machine learning. Semi-supervised learning is most useful when the dataset at hand is a mixture of labeled and unlabeled data points.
Some Basic Statistics Concepts
Here are some statistics concepts that are useful to know:
- Mean: This is the average value in a set of data points
- Median: This is the middle number in a set of data points
- Mode: This is the most frequent number in a set of data points
- Standard Deviation: This is a measure that tells you how dispersed the data points in a data set are in relation to the mean value(average value)
- Interquartile Range: This is a measure of spread in statistics. Interquartile range is also known as the "middle fifty" and is calculated using the formula:
IQR(Interquartile Range) = Q3(Third quartile) - Q1(First quartile)
- Skewness: This is a measure of asymmetry of the probability distribution of a dataset about its mean
- Variance: This is a measure of the variation among values in a dataset
- Covariance: This is a measure of how two variables in a data set will change together. A positive covariance indicates a positive relation between the two variables and visa versa for the negative.
- Normal Distribution: This is a probability distribution function that looks like a bell. Here is an image of a normal distribution:
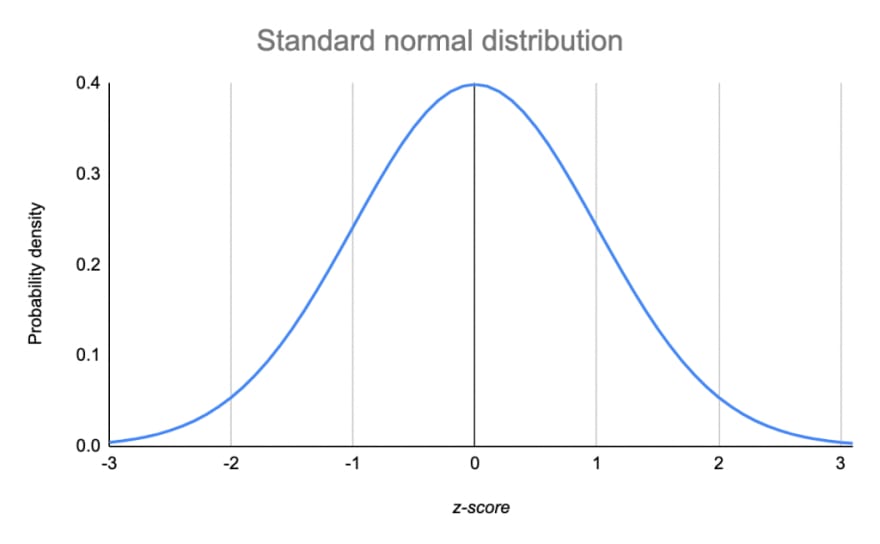
Figure 1: Normal Distribution Graph
- P-value: This is a statistical measurement tool used to measure the probability of obtaining a desired result or outcome from statistical hypothesis testing
Conclusion
Well that's it for this post! Thanks for following along in this article and if you have any questions or concerns please feel free to post a comment in this post and I will get back to you when I find the time.
If you found this article helpful please share it and make sure to follow me on Twitter and GitHub, connect with me on LinkedIn, subscribe to my YouTube channel.


Top comments (0)