
One of the challenges when building a single-page application (SPA) like dev.to or an app where users have standart session more than 10 minutes, is testing for memory leaks at a large scale. Manual testing, finding and analyzing memory leaks can be time-consuming and inefficient, especially when there are a large number of changes being made continuously by a large team of developers.
This article demonstrate how to detect and automatically detect memory leaks in large applications, and how to avoid memory issues for a long period of time.
Catching users experiencing problems
Hi, dear developers. I've encountered a problem with freezing. Could you help me?
How does it happen that some users complain about everything freezing and slowing down, while everything works fine on our expensive and beautiful Macs?
The issue is that it can be challenging to replicate the problem without having access to the specific devices that your users log in from, and due to privacy settings, we may not be able to recreate the exact environment that the user experiencing the issue is in.
Fortunately, browsers provide us with technical data about devices and how much memory your site consumes or allocates for certain actions. There is an API for this information, which is called the "Performance: memory" property.
Solution: To write a small script that checks the performance of the system from time to time. If it detects that memory usage has exceeded a certain threshold, it can indicate that the user may be experiencing issues with RAM or a memory leak. In such a case, it is best to send all relevant technical metrics to assist in diagnosing and fixing the problem. Here is a small example:
// Memory usage threshold (e.g. 80% of jsHeapSizeLimit)
const threshold = performance.memory?.jsHeapSizeLimit * 0.8

// Function for checking and sending memory data
function checkMemoryUsage(): void {
  if (!performance.memory) {
    console.warn('Performance.memory API is not available.');
    return;
  }

  const { usedJSHeapSize, jsHeapSizeLimit } = performance.memory;
  console.log(`Current memory usage: ${usedJSHeapSize} of ${jsHeapSizeLimit}`);

  if (usedJSHeapSize > threshold) {
    sendEvent(`Memory usage exceeded: ${usedJSHeapSize} exceeds threshold of ${threshold}`);
    sendSnapshot({
        device,
        userAgent,
        os,
        ...
    })
  }
}

setInterval(checkMemoryUsage, 10000)
NOTE: Please note that this API is not supported in all browsers and
has recently been marked as deprecated. Sounds like that replaced by measureUserAgentSpecificMemory
Here we send the userAgent, device as data (there may be a problem with the device itself), and of course i would recomend also send specific for you date as example: size of the store, number of DOM nodes and etc...
Catching on a dev stage with MemLab
We have figured out how to perfectly catch problems from real users, but this approach seems rather rash and dangerous for a large-scale enterprise project. It would be nice if our development team could highlight possible problems at the assembly or testing stages.
Fortunately, Facebook has a separate team that deals with performance and quality issues. So, they developed a special tool for detecting problems at the development stage and made it available as open-source - MemLab. Now, I'll talk more about it.
How it works
In short, Memlab finds memory leaks by running an offline browser according to predefined test scenarios, as well as by comparing and analyzing snapshots of the JavaScript heap.
This process takes place in six stages:
- Browser interaction
- Diffing the heap
- Refining the list of memory leaks
- Clustering retainer traces
- Reporting the leaks
You can read about all these steps in detail in the official documentation.
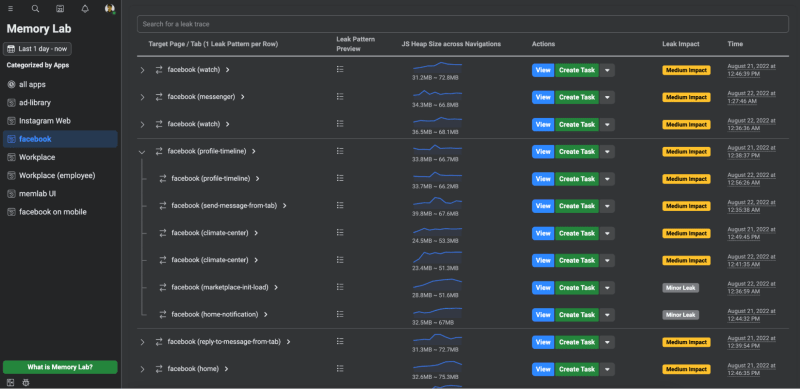
Simply put, MemLab takes a snapshot of all the metrics every time and compares them to the standard, as shown in the image below:

After that, it generates a detailed report on all possible new problems, with detailed information about what was changed and how:
I would consider the disadvantages that this tool requires very careful configuration and description of all possible scenarios and screens, while if you believe the Facebook presentation, they were able to halve memory consumption and almost get rid of performance problems (crashes)
And this tool also allowed us to find a leak even in react.js
Conclusion
So, nowadays, we should still not forget about the cost of JavaScript and identifying performance issues. These can mean a lot and significantly affect a company's profits or costs.
So, for example, I once worked to speed up the customer support chat for a popular European bank. The average session time for agents was 5-6 hours without restarts, but due to lag in the interface, the average user response time was around 140 seconds. After implementing two tools and fixing problems identified, both support agents and users were incredibly happy, as response time had dropped by almost half to 80 seconds. Agents themselves told me that it was nice when everything worked smoothly and quickly (I think this was because their salary depended on it too, haha).
Good luck and speed to your projects, and no MEMORY LEAKS anymore!

Top comments (0)