What's an "/open" page?
An /open page is a page where a startup or product shares their metrics publicly. The metrics are usually things like number of active users, revenue and any other stats specific to the product (for instance, a primarily web-based content-consumption site may include pageviews). You can see a list of some open startups here.
I recently decided to add open pages to my products. There are different reasons you might want to do or not do this, but for me, I like the transparency and the idea of sharing stuff that might help other people. It's also an easy source of validation—seeing encouraging stats makes you feel like you're doing something right. It can also be a marketing avenue for your product—folks are curious; seeing you have 1k users might induce them to try it out.
I decided to start with thisvid.space. Here's the final product: thisvid.space/open.
Deciding what to put there
First off, I needed to pick the metrics I was going to share. I did this by thinking of the kinds of entities the product deals with.
- @this_vid is a Twitter bot for downloading videos from Twitter, so obviously videos downloaded and Twitter activity (mentions and probably followers) would be relevant.
- There's a website component to it (you visit thisvid.space to see your downloads), so pageviews would make sense.
- As an alternative to visiting the website, you could enable browser push notifications, so I added push notifications.
- thisvid.space doesn't have any specific concept of "users" (although you need to authenticate with Twitter to enable push notifications), so I didn't include that.
- I didn't have any consistent or significant revenue from thisvid.space yet, so no need for that.
- Finally, I decided to include expenditure.
Alright, let's get to work then!
Implementing
Calculating the metrics
There are two parts to building this: tracking the data and computing the metrics. For each category, if you aren't already tracking the data, you'll need to first set up tracking and see it bring in results before you can compute stats from that. In my case, I (or the service provider) had already been tracking most of the needed data for some time.
Twitter follower count
Twitter follower count was easy to get from the Twitter API (using the Twit library):
const screenName = process.env.TWITTER_SCREEN_NAME;
return twit.get(`account/verify_credentials`, {screen_name: screenName})
  .then(r => r.data.followers_count);
Twitter mentions
The number of Twitter mentions in a specific time period can't be retrieved easily from Twitter's API (especially if the time period is large), but I had already been recording mentions on AWS CloudWatch for a long time in a metric called "Requests" (you can see the code in this file).
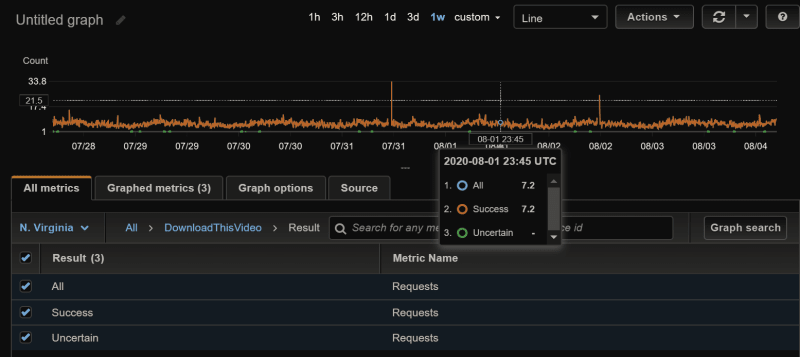
A few explanations (note that the values of Count in the screenshot above are in thousands):
- To store a datapoint to a metric on CloudWatch, you must identify it with a dimension. A dimension is sort of a way of classifying the datapoint. In my case, I'd named the dimension "Result", because I wanted to tag each request with the result (was the download successful or not?).
- For each datapoint, I stored two datapoints: one with
Resultas "Success", "Uncertain" or "Fail", and one withResultas "All". That way, I could view successful downloads by filtering forResult=Success, or view all withResult=All.
So what I had to do was use the AWS API to retrieve the sum of the "Requests" metric for the past 7 days, with dimension filter Result=All:
const now = new Date();
const params = {
  StartTime: new Date(now.getTime() - (7 * 24 * 60 * 60 * 1000)),
  EndTime: now,
  MetricName: 'Requests',
  Namespace: 'DownloadThisVideo',
  Period: 7 * 24 * 60 * 60,
  Statistics: ['Sum'],
  Unit: 'Count',
  Dimensions: [
    {
      Name: 'Result',
      Value: 'All',
    },
  ],
};
return cloudwatch.getMetricStatistics(params).promise()
  .then(r => r.Datapoints[0].Sum);
Videos downloaded
This was where the real challenge was. I couldn't use the Requests metric because I wasn't 100% sure of its accuracy for the "Success" results. More importantly, it counted every single request, but what I wanted was the unique number of videos; each video should only count once, no matter how many times it had been downloaded.
Luckily, this_vid caches video download links in Redis for 7 days to avoid hitting Twitter API limits. You can see here that when responding to a user, it first looks for the tweet ID in the cache before calling Twitter's API. This means I could just count the number of links I had in the cache at any point in time. Yay!🎉
How to do this then? I checked to see if there was a Redis command that could give me the number of keys matching a pattern (tweet-*). The best I could find was the SCAN command, which supports a pattern but returns the actual keys. It returns two results, the first one being a cursor (for pagination) and the second a list of all the matching keys. So the length of that list would give me the number of downloads. Nice.
SCAN is not a command you want to run (often) in production since it may check all keys in the database (this_vid's cache has over 30k keys), so I did a few test runs from my machine. It turned out to be okay, returning results in 3 seconds or less. 3 seconds isn't an ideal time frame in the context of a user visiting the webpage (since other processing is also done, plus the request and response need to go over the network), but something I decided to not worry about at the time. The test runs also helped me pick a value of count (10000000) that ensured I got all the results in one go, rather than the paginated version.
Here's the eventual code:
// 0 is the cursor number to start from; you can ignore that
return cache.scanAsync(0, 'match', 'tweet-*', 'count', 10000000)
  .then(result => result[1].length);
One limitation of this was that I couldn't isolate the videos count into a different time period (for instance, videos in the last day or last month). I could theoretically do it by getting each tweet ID and checking the expiry time to determine if it falls into the time period. But that amount of computation isn't worth it.😐
This limitation was the reason I pegged the mentions at 7 days as well, to reduce the disparity of time periods between stats.
Pageviews
I'd recently added Google Analytics to the site (thanks to a friend's suggestion), so calculating pageviews was a matter of calling the GA Reporting API with my desired time period. Fortunately, I'd done a project at work where I had spent some time with this API, so I knew my way around.
For a time period, I went with "yesterday", because "7 days" felt too large a time frame for pageviews. Also, "yesterday" refers to the actual calendar day before today, not the past 24 hours. The Reporting API only gives data by days, so I couldn't get data from arbitrary periods like "the past 24 hours". (I think there's a Realtime API, but I didn't want to figure that out.)
return analytics.reports.batchGet({
  requestBody: {
    reportRequests: [
      {
        viewId: "<analyticsViewId>",
        dateRanges: [{startDate: "yesterday", endDate: "yesterday"}],
        metrics: [{expression: "ga:pageviews"}]
      }
    ]
  }
})
.then(r => r.data.reports[0].data.totals[0].values[0])
Expenses
I decided to hardcode this on the frontend. I considered integrating with the different service providers (currently Redis Labs and AWS), but I realised that there was no point doing that work for something that I only needed to retrieve once a month.
Putting it all together...
The code to retrieve the metrics and pass to the frontend ended up looking something like this:
const [
  mentions, downloads, followers, pageviews,
] = await Promise.all([
    stats.getNumberOfMentionsInPast7Days(),
    stats.getDownloadsInPast7Days(),
    stats.getFollowersCount(),
    stats.getPageViewsInPast2Days(),
  ]);
return render('open', {mentions, downloads, followers, pageviews});
Frontend
For thisvid.space, I've been going with a simple UI: text and links. Decided to keep that theme on the open page too, so it's a simple list of metrics.
Fixing an oversight
I wrapped up the implementation, tested and launched, only to get a big shock: a lot of people were getting 502 errors.😱
A quick look at the logs showed me the problem: I had hit my Twitter rate limit. Imagine 1000 people visiting the page at once. That means 1000 Twitter API calls! Noob mistake.😞
I quickly realised my mistake and what the solution would be: cache the stats and serve them from the cache, and only update them at sensible intervals. I decided on an interval of one hour.
For the implementation, I added a line after each stats calculation that saved the value to the cache. FOr instance, the "videos downloaded" calculation turned into this:
return cache.scanAsync(0, 'match', 'tweet-*', 'count', 10000000)
  .then(async results => {
    // "toLocaleString" formats in a friendly manner for the frontend
    const downloads = Number(results[1].length).toLocaleString();
    await cache.setAsync('stats-downloads7', downloads, 'EX', 1 * 60 * 60);
    return downloads;
});
And then when retrieving them for the frontend:
const [
  downloads, mentions, followers, pageviews,
] = await Promise.all([
      cache.getAsync('stats-downloads7').then(r => {
        return r == null ? stats.getDownloadsInPast7Days() : r;
      }),
      //...
  ]);
return render('open', {downloads, mentions, followers, pageviews});
Adding caching also helped me fix the performance bottleneck: remember the SCAN query that took up to 3 seconds? By caching the result, I could speed up requests for the page, since I would only run that query once every hour. As an added benefit, I would eliminate any chances of overloading the Redis server or causing problems for other queries.
Other considerations
Including graphs
Open pages often include graphs, which are a useful way to show the growth of a value over time, rather than just the current value. I decided against this, however, because most of my data was only available in fixed time periods. I could graph the mentions and pageviews, but I felt it would add a bit of complexity and confusion to the page.
Discarding some metrics
I ended up ditching the "number of push notifications" idea. Push notifications on thisvid.space are implemented with Firebase, and I couldn't find any easy ways of retrieving stats for notifications sent (and I hadn't been tracking them myself). It's one of the less significant metrics, so I can do without that.
I had a lot of fun building this. I initially thought it would be more challenging, so I was pleasantly surprised that I was able to do all this in a matter of hours. 😅
@this_vid is open-source, so you can check out the full source code for yourself. Here's where I compute and cache the metrics, and here's where I retrieve them for the frontend.

Top comments (1)
That's really amazing