In the early days of web development, there was one way to measure code: WTFs per minute. It was a metric that could be applied across all languages, as every developer knew what WTF meant (Works That Frustrate, obviously).
Today, however, code is too intricate — and important — for clever, opaque metrics. You need objective data that communicates the quality and stability of your code — KPIs such as events accepted, transaction outcomes, and crash-free sessions.
For Measurement May, we’re building out features designed to deliver the right metrics, all so you can drive the right outcomes for your organization.
Create Your 0wn Visibility with Custom Dashboards
Understanding the state of your application starts with understanding the errors, transactions, and attachments that make up your event data. With our latest update to Dashboards, you’re able to surface critical event data as well as share that data across your organization. While we’ve equipped Dashboards with a library of prebuilt widgets — issues by region, performance over time, release quality over time — you can also build your own custom queries within your personal dashboard.
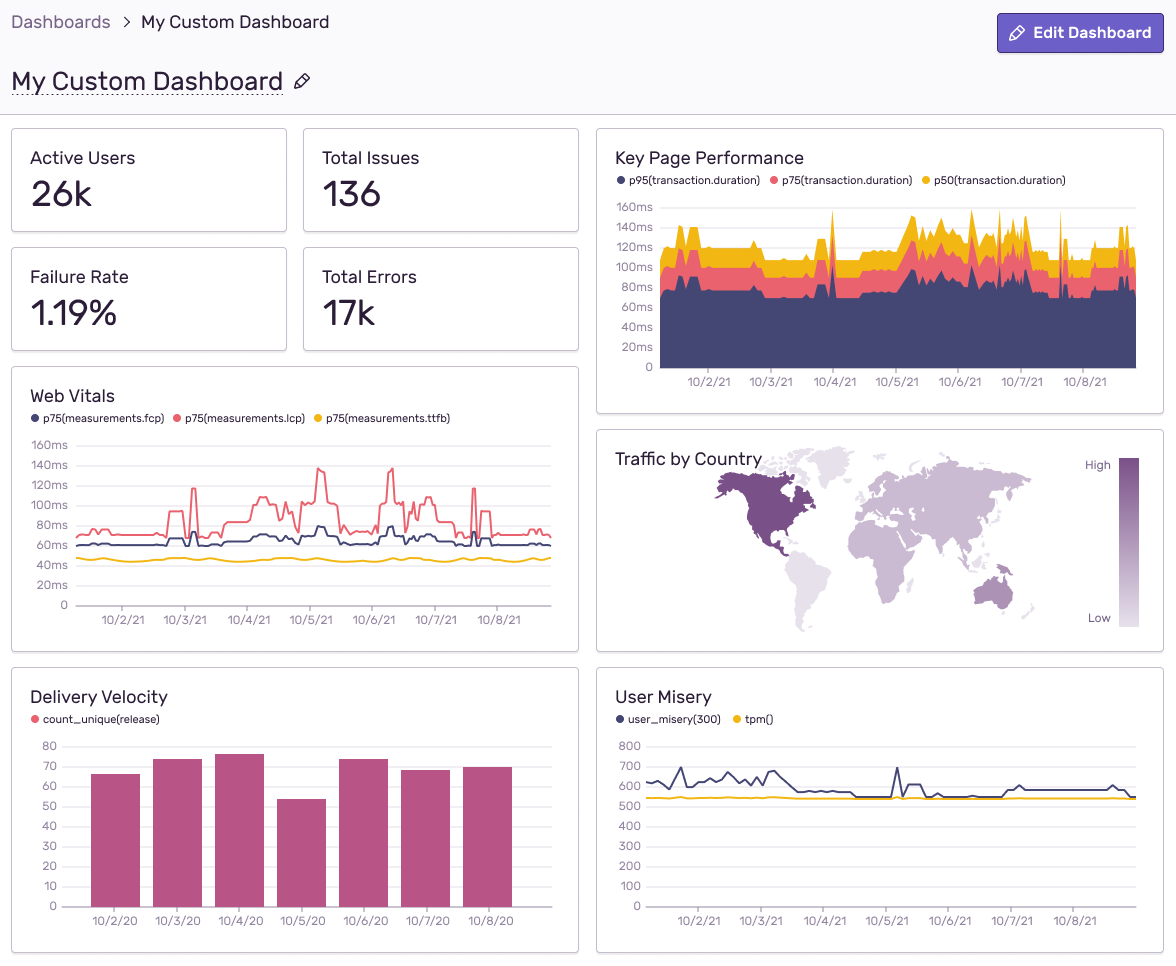
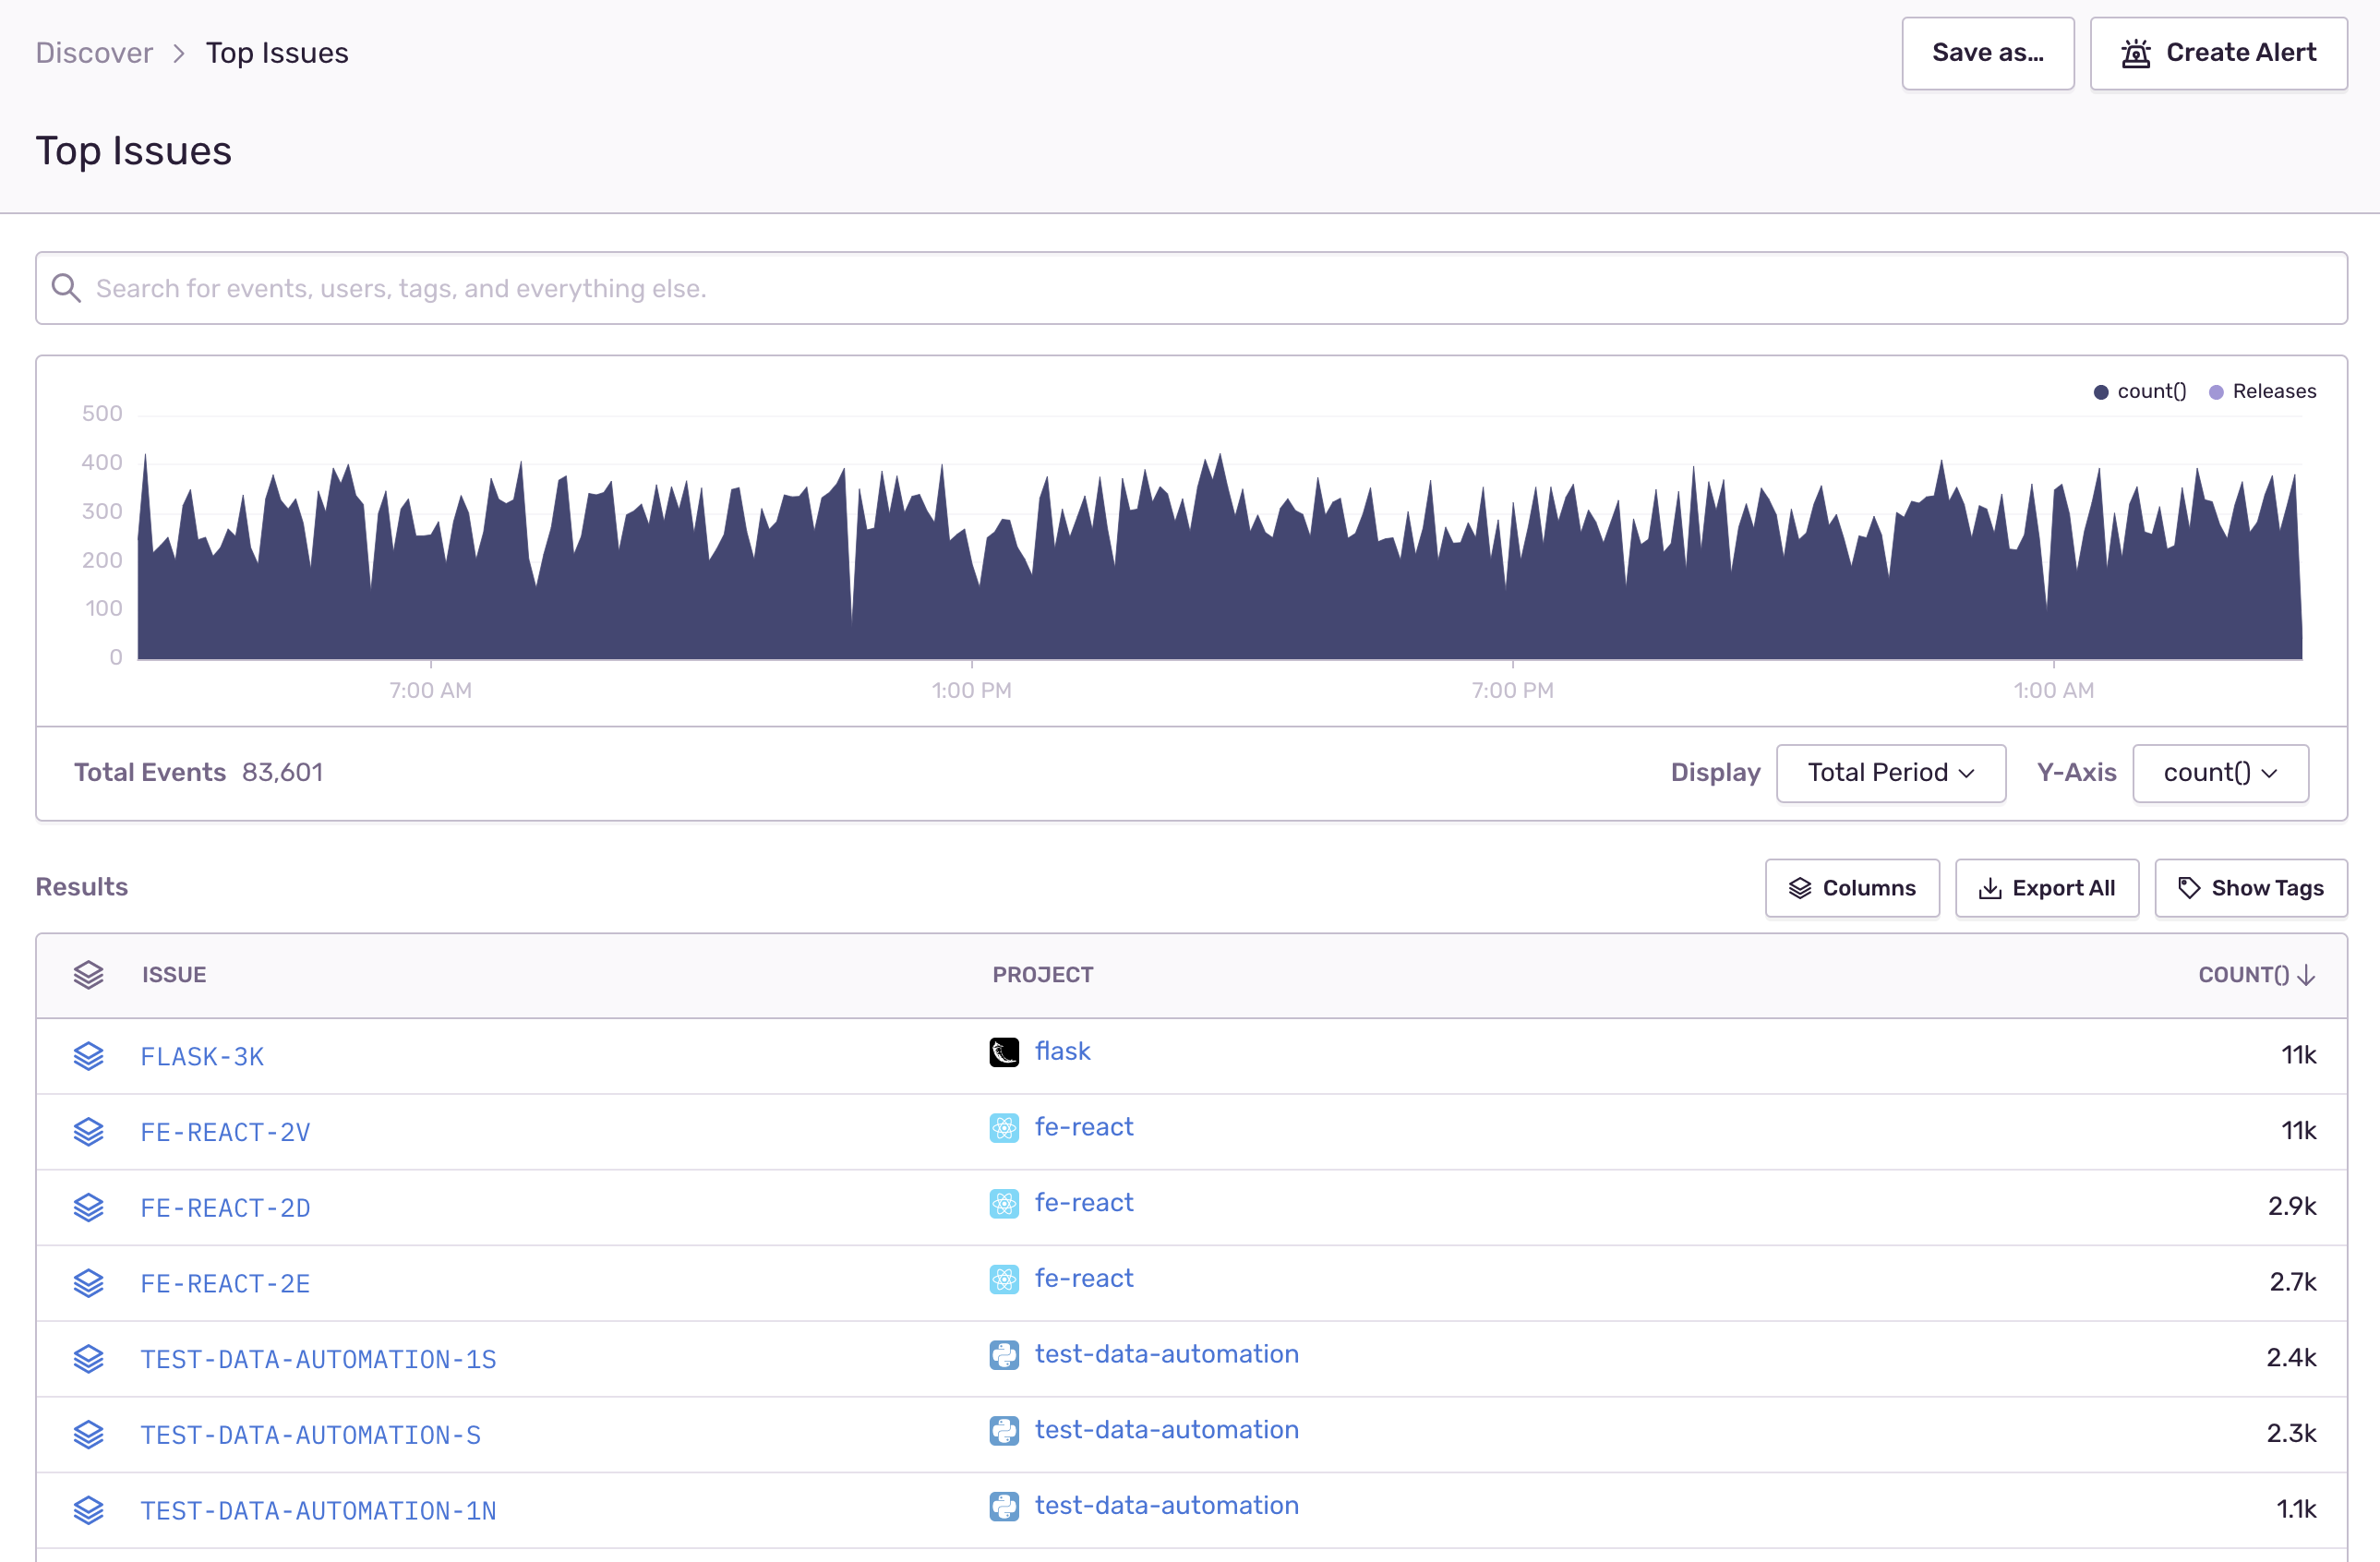
And you can enhance your visibility even more when you combine Dashboards with Discover, our query builder. Say you've built a widget that compiles top issues across all your projects:

When you open this widget in Discover, you can measure progress across multiple projects over time while also comparing additional filters — unhandled errors, URL, browser type, etc. This way, instead of scrolling through listed queries, you’re able to provide clear visualizations to higher-level managers so you can achieve consensus over what to do next.
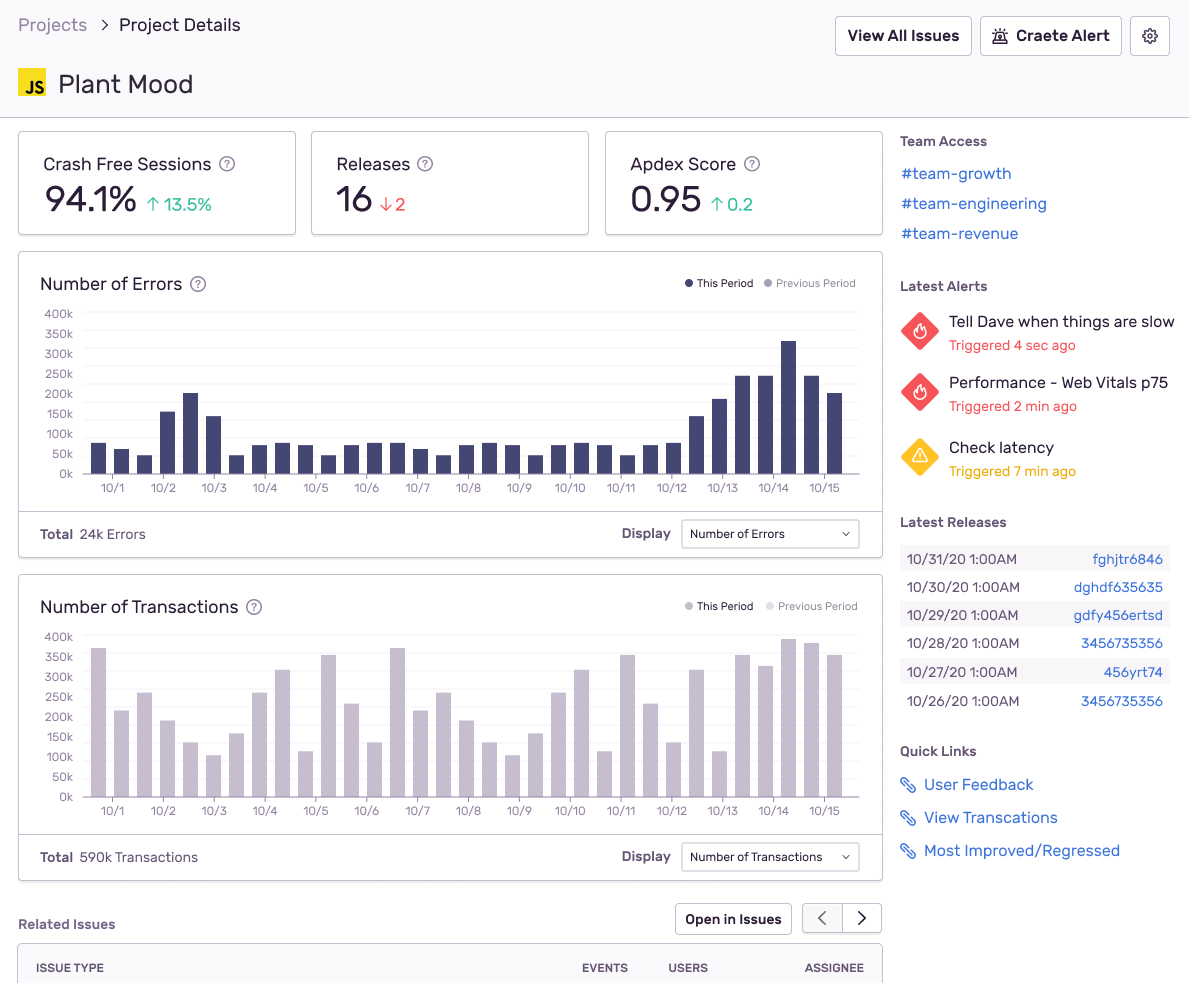
All Details, One View with Project Details
It’s a common plight among developers: twenty tabs open, just to figure out one problem. Your errors, transactions, and sessions shouldn’t be spread across different screens. They should be available on one screen, and at a glance. Our new Project Details page unifies a developer’s monitoring experience across all aspects of a project - health, speed, recent alerts, and releases. With it, you’re able to see project-wide KPIs for stability (crash-free sessions), velocity (number of releases), and performance (Apdex score). You can also compare this data over time so that you’re able to track incremental progress.
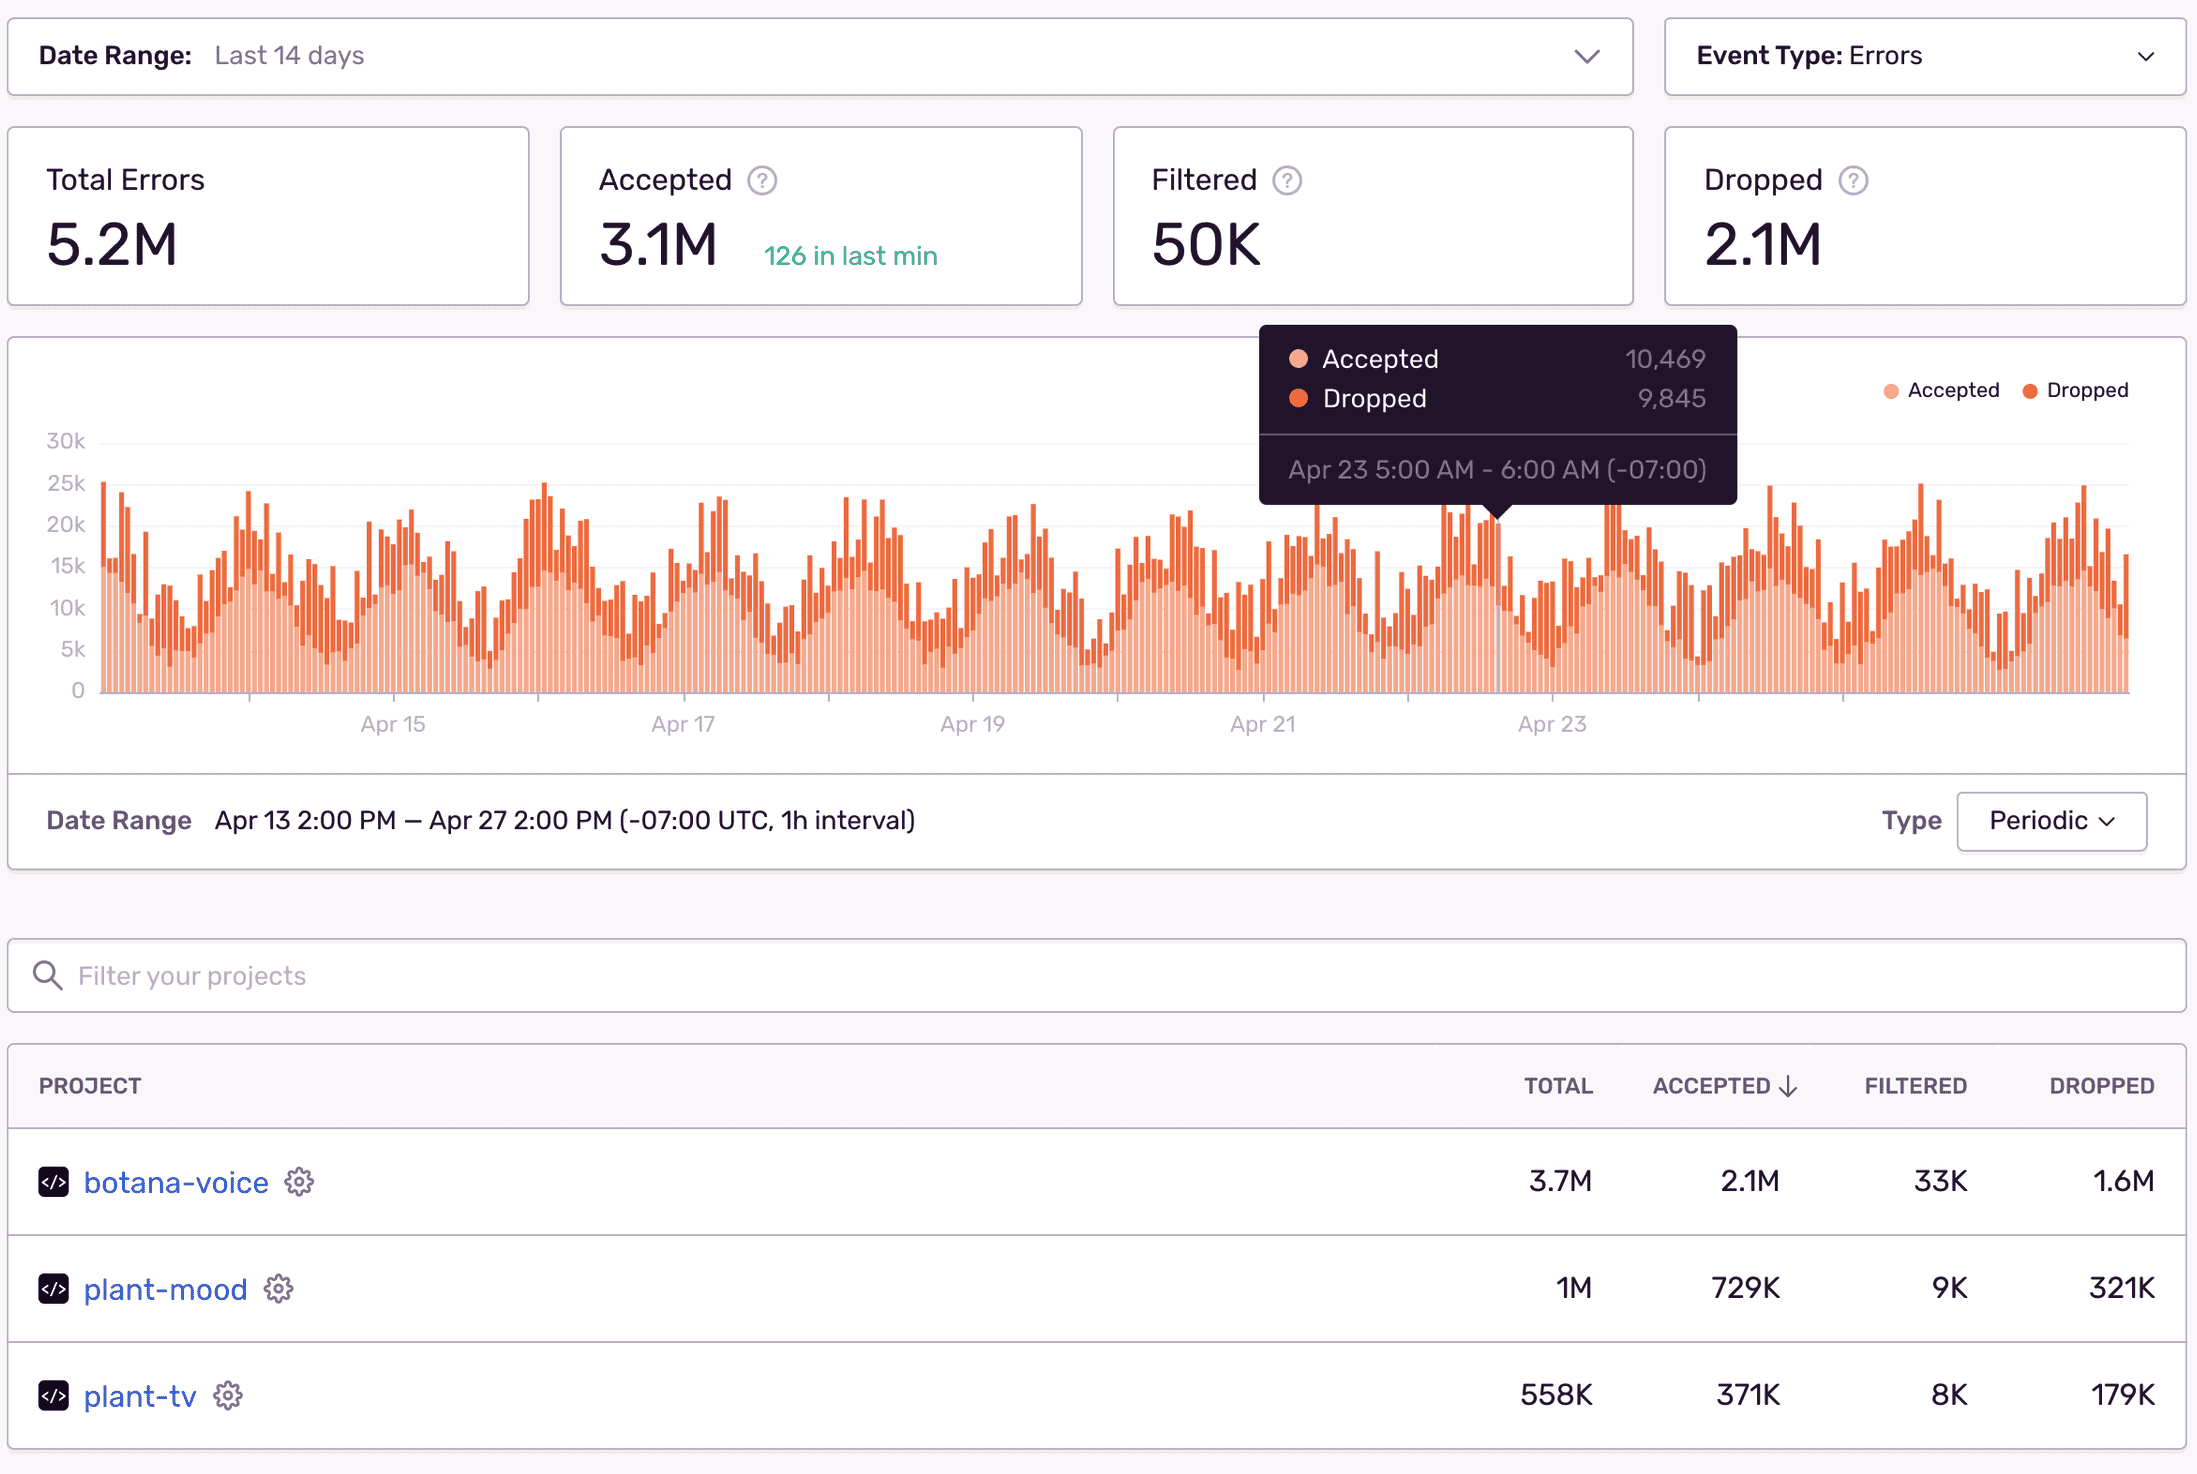
Know How Much Sentry You’re Using with Org Stats
For developers who manage other developers, statistics is the language you use to control spend, manage quotas, and create efficiencies. With our new Org Stats page, you now have the information you need to see which areas of your codebase demand the most resources. With it, you can track how many issues are being created — and resolved — per week for each project. Charts and tables also provide insight into per-project usage over time of your errors, transactions, and attachments. Now you can not only see which projects had a recent spike, but you can also link to the project details screen and immediately see what needs to be addressed.
Measurement May is upon us. Here’s a primer on Google’s upcoming Web Vitals update, and also join us on May 20th for a live demo on how to build custom dashboard widgets and much more.
New to Sentry? Try it for free today or contact sales@sentry.io to get started.


Top comments (0)