
At Sentry, we’re always looking for innovative ways to dogfood our product. Over the last year we added Sentry’s error monitoring to our developer environment so that we could better understand the health of it.
In this blog post I’m going to touch on how fragile local development environments can be, how we brought observability into what’s happening by introducing Sentry, and what outcomes it has driven for our engineering organization.
Development environments are fragile
As programmers, we typically spend a lot of time getting our local development environment set up: installing dependencies, managing multiple versions of an SDK or supporting tools, and so on.
Getting set up can take some time, however it’s usually straightforward because you’re starting from a clean slate. What becomes more challenging is when a previously good environment gets into a bad state. For example, you need a newer Python version for your virtualenv, a new library is missing, or your pre-commit hooks are out of date.
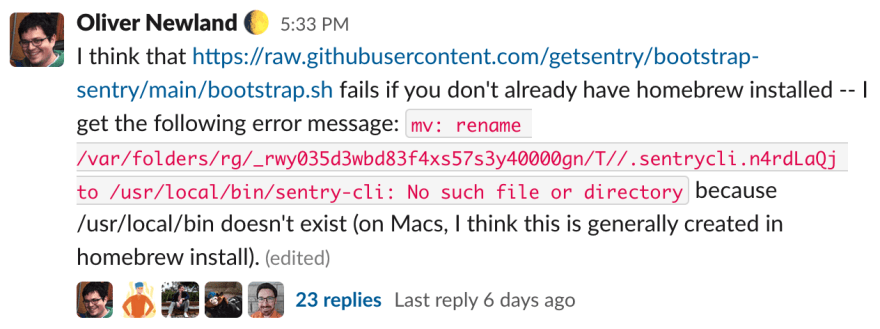
When things go wrong, it’s frustrating because your real work – building software – stops and you instead have to invest your time trying to unstick your environment. When the answer isn’t obvious, you have to go into Slack, ask for help, and hope that someone is around who can help you troubleshoot. And now you’ve interrupted their regular work too.
Getting alerted to problems during development
Typically, Sentry is used for monitoring software in production. When your software goes live in front of users, you want visibility to understand whether that software is operating successfully. Are there any errors? Is the performance acceptable?
However, for our Developer Productivity team, the local development environment used by our engineers is our production environment. Software engineers at Sentry are our users, and we similarly want to understand if the development tools we’re shipping are working successfully. For instance, are Python packages failing to install for some users?
What if we could be alerted when a developer’s environment goes bad? To figure this out, we instrumented Sentry into our local development toolchain.
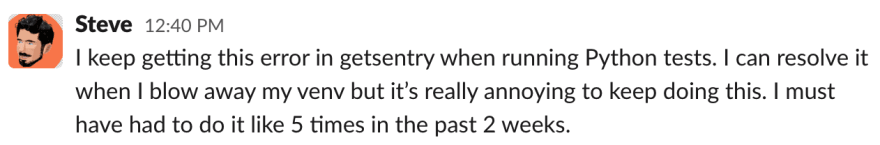
When we don’t properly triage development environment issues, developers can suffer the pain for some time until they report it.
Instrumenting Bash scripts with Sentry
Our development environment is generally powered by a lot of Bash scripts (If you have other environments go to the platforms page and see if yours is supported). Those scripts do everything from installing Python versions, setting up Git commit hooks, prompting developers to update their dependencies, and so on.
To have visibility into what was happening in our Bash scripts, we turned to sentry-cli. Sentry-cli is a command line executable written in Rust that communicates with the Sentry API. Typically it’s used for administrative tasks like sending a test event from the shell, uploading source maps, or letting Sentry know about a new version of your software.
Sentry-cli also has an interesting feature: it provides a bash hook that detects unhandled failures in a bash script and automatically reports those failures to Sentry. In the example below, sentry-cli is initialized in a Bash script (see docs):
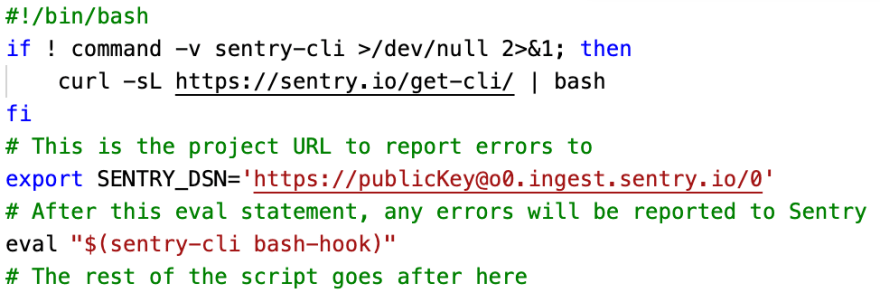
If the Bash script fails, an error event is sent to Sentry with a traceback, the values of any active environment variables, and the console output is captured as breadcrumbs.
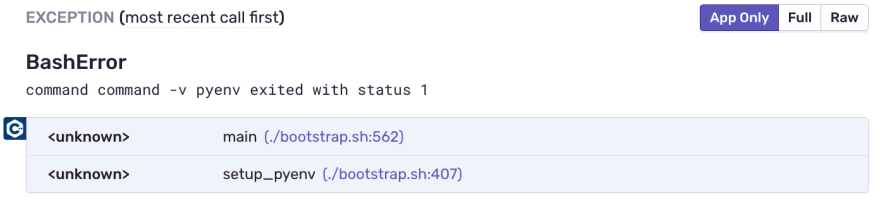
Bash traceback showing the lines and scripts that were involved when the error occurred.
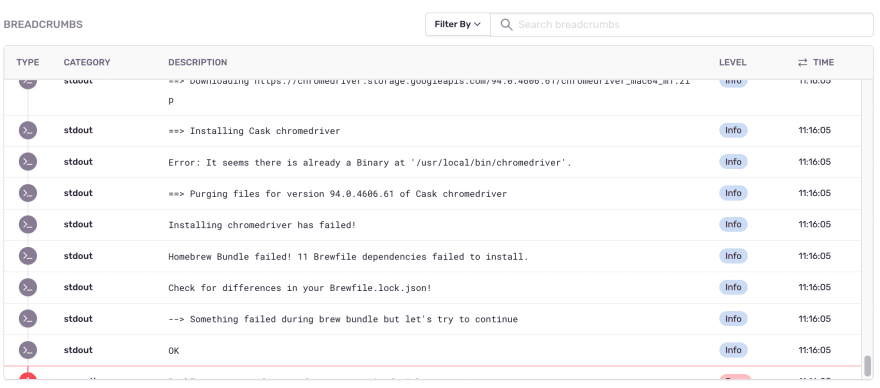
Sentry’s breadcrumb trail shows the emitted debug output that occurred before the failed Bash command
Monitoring our development environment users
Let’s fast forward: at this point we instrumented most of our development environment scripts with Sentry. Let’s look at what the flow for helping a co-worker bootstrapping their development environment is like.
As mentioned earlier, if a script failure is encountered, sentry-cli sends an error event to Sentry’s servers. This has the effect of creating an alert within Sentry, which gets broadcasted to our team channel on Slack.
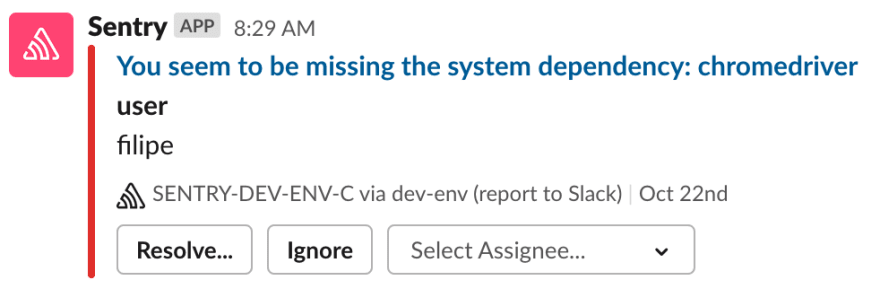
From there, we click through the Slack link which takes us to the event inside Sentry. Then we can determine which engineer is facing the issue (this is taken from the $USER environment variable) as well as what the issue is from the console output.
Since we know who’s facing the issue and what kind of problem they’re facing, we can get in touch with the developer armed with some context and a readiness to help!
We can easily find the root cause of an issue that may be difficult to reproduce because we reached out to the engineer near the moment of occurrence and are invested in getting it fixed.
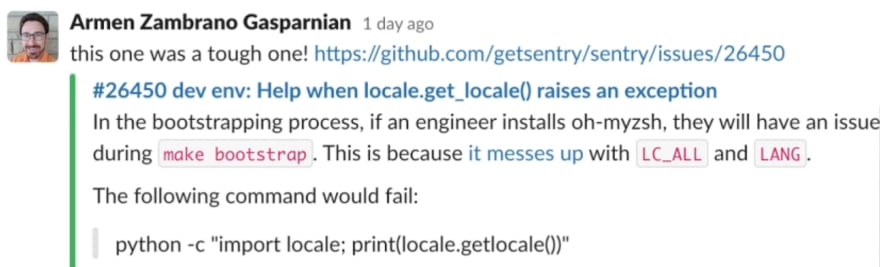
Here’s an example of an issue we had not been able to pinpoint for several months. Working with the engineer while they were investigating it lead to a fix.
The impact
Instrumenting our development environment with Sentry has allowed us to monitor the health of our development environment and respond more quickly when someone faces an issue. Over the last year, we’ve seen the following positive outcomes for the engineering organization:
We can help an engineer that is currently investigating an ongoing issue. This increases the chances of fixing the root cause of the issue and preventing others from facing the same problem rather than the issue being worked around (Not all engineers are comfortable solving their own dev env problems).
We can be notified of tooling regressions. It’s easier to fix a regression when you’re notified soon after having merged your code. Without alerting, a regression might take a while to be reported. For instance, a developer may work around the issue on multiple occasions a few weeks after the code at fault has landed.
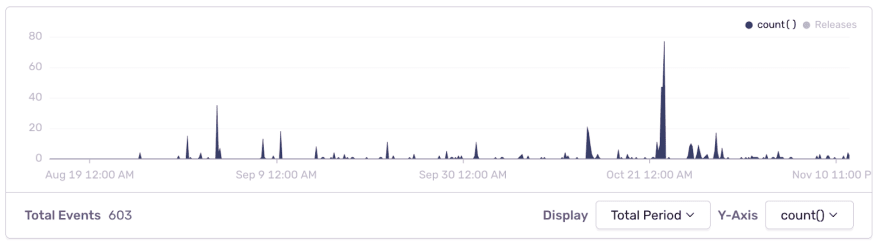
This shows the development environment issues in the last three months and shows when regressions were introduced
Wrapping up
We have covered how instrumenting a development environment with Sentry can positively impact the productivity of your engineering organization by increasing the observability and decreasing the response time to issues.
Thanks for reading this post. If you want to try out Sentry without creating an account, visit the Sentry Sandbox and feel free to play with it!
Thanks to Billy Vong for paving the way with the bootstrapping code, Ben Vinegar for encouraging me to write this post, and for Zac Propersi’s managerial support.

Top comments (0)