Article originally published on Tinloof.
Sbaï Dentaire is the number 1 user-rated dental practice in Casablanca (Morocco) by Google users:

Many patients book appointments through the website on the go from their mobile, therefore page speed is critical to avoid a high bounce rate.
This article explains how we improved the performance of their website, which is built with Gatsby.
Note about Gatsby: this is just a simple presentation website, it would have made sense to implement it with pure HTML, CSS, and JavaScript. It would avoid the cost of extra JavaScript that comes with Gatsby and React, and the performance should be better than anything we'd try to achieve with Gatsby.
However, there is a plan to integrate a blog to the website in the future and Gatsby makes it easier.
Measuring performance
Measuring performance steers our work by identifying potential performance issues and making sure we're progressing in the right direction after making any changes.
How to measure performance?
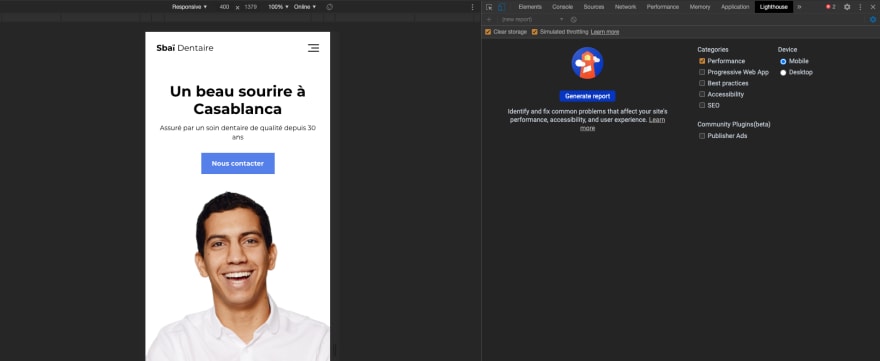
To measure the performance, we use Google's Lighthouse tool, which is available out of the box in Chrome:
To keep the test conditions as close to the live version, we make sure of the following:
The tests are made on the production build.
We focus on mobile users since they tend to be the ones with the most critical network connection. Having a high performance on mobile is also often followed by an even higher one on desktop.
The tests are made in Chrome Incognito mode, to avoid getting affected by Chrome Extensions. This is recommended by Lighthouse itself:

- The Simulated Throttling option is enabled in Lighthouse. This enables us to simulate a realistic slow network connection:

- Lighthouse scores vary for each time you run it. To improve the accuracy of our measured progress, we conduct 3 runs per performance test instead of 1.
We also keep track of 3 metrics:
- Performance score (the most important one): overall performance of the page.
- First Contentful Paint: time (in seconds) it takes for the first element in the DOM to render.
- Time to Interactive: time (in seconds) it takes for the page to fully load and the buttons/inputs to be usable.
About the current performance
When we run the first 3 tests with Lighthouse, we get the following:
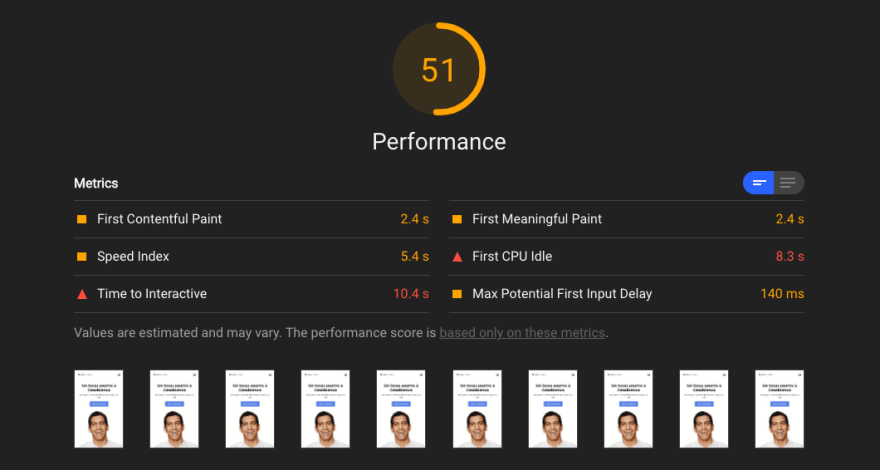
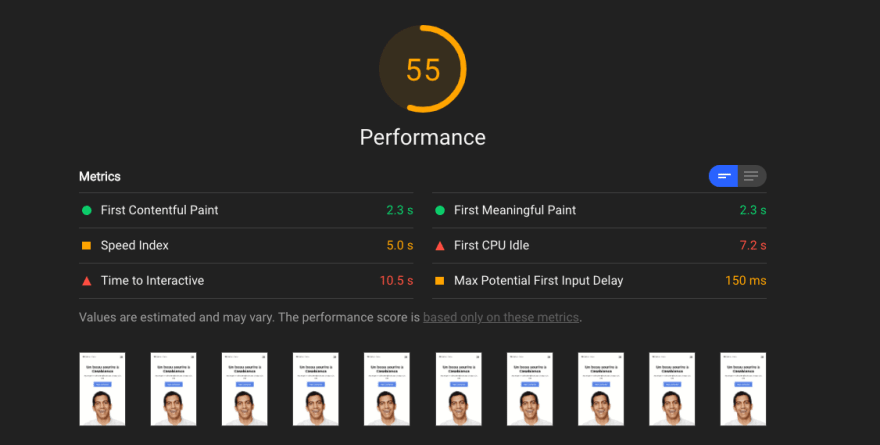
When we average the metrics in the 3 tests, we get the following:
| Metric | Value |
|---|---|
| Performance | 54 |
| First Contentful Paint | 2.1 s |
| Time to Interactive | 10.6 s |
Although the First Contentful Paint time is acceptable, the performance score and the Time to Interactive should definitely be improved.
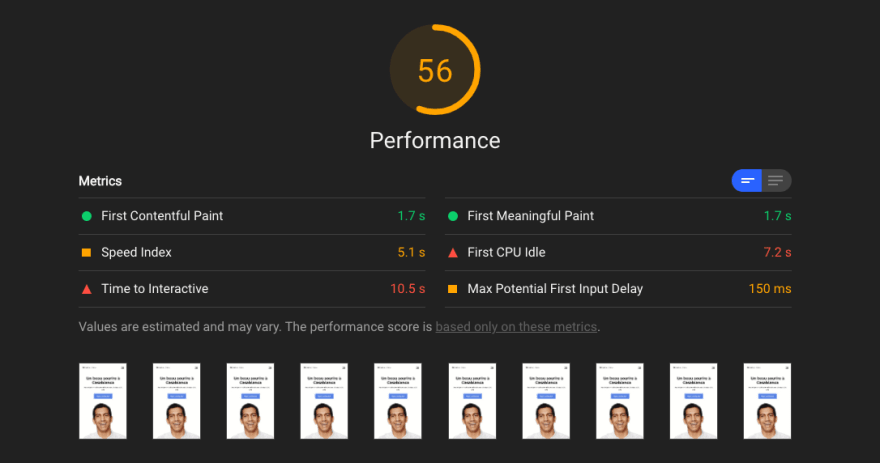
Where do we stand against competitors?
We ran the same tests with the other top 4 ranked dental practice websites and gathered the following data:

From what we see in the graph above, Sbaï Dentaire's website is performing well relative to competitors (aside from Competitor C).
C outperforms Sbaï Dentaire in the overall performance score and in the Time to Interactive.
This emphasizes the importance of prioritizing these 2 metrics. Nonetheless, we should try to improve the First Contentful Paint if possible.
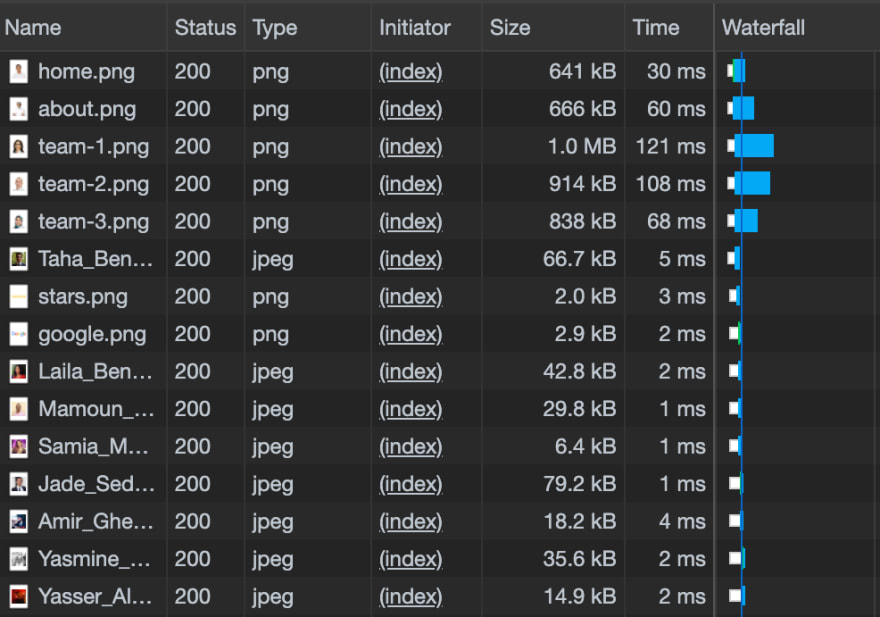
Improving the performance of images
One problem we quickly notice is that the website is making huge network requests to fetch images (mostly greater than 600 KB of payload):

Another issue is spotted in the Network Tab where we see that images are fetched simultaneously at page load:
We can do so by:
- Using WebP format for images for browsers that support it. This format provides an image compression that is way more efficient than png, which shaves a lot of kBs from our images.
- Lazy-loading images to only fetch the ones visible in the viewport. This improves the work done by the browser when loading the page for the first time since a large part of the images won't even be loaded.
- Saving on request payload by reducing the requested size on mobile. This technique is known as Art Direction.
We'd normally use gatsby-image to handle the previous issues, but there is a bug in the library affecting Art Direction. Fortunately, we can use the module gatsby-plugin-sharp with the native <picture> tag to achieve the same result.
gatsby-plugin-sharp can apply the necessary transformations through GraphQL queries. Here's an example query we used to transform home.png, the image used in the home section:
function getImageSources() {
  const data = useStaticQuery(graphql`
    query {
      mobileImage: file(relativePath: { eq: "home.png" }) {
        childImageSharp {
          fixed(width: 500) {
            ...GatsbyImageSharpFixed_withWebp_noBase64
          }
        }
      }
      desktopImage: file(relativePath: { eq: "home.png" }) {
        childImageSharp {
          fixed(width: 900) {
            ...GatsbyImageSharpFixed_withWebp_noBase64
          }
        }
      }
    }
  `);

  return {
    mobileImage: data.mobileImage.childImageSharp.fixed,
    desktopImage: data.desktopImage.childImageSharp.fixed
  };
}
The function getImageSources :
- Gets two different sizes for
home.png(500px for mobile and 900px for desktop). - Uses
GatsbyImageSharpFixed_withWebp_noBase64fragment to get thesrc,srcSet,webpSrc, andwebSrcSetdata for both sizes. These attributes are then used to apply proper Art Direction with apicturetag.
We can then use the data to tell the browser to:
- Fetch the mobile image for screens less than 480px of width.
- Use
webpformat when possible (since not all browsers support it).
To avoid code redundancy, and make sure loading=lazy attribute is used with all images, we create an Image component to use whenever we want to render images:
function Image({ image, desktopImage, styles, alt }) {
  return (
    <picture>
      {desktopImage && (
        <>
          <source media="(min-width: 480px)" srcSet={desktopImage.srcSet} />
          <source
            media="(min-width: 480px)"
            srcSet={desktopImage.srcSetWebp}
            type="image/webp"
          />
        </>
      )}
      <source srcSet={image.srcWebp} type="image/webp" />
      <img
        src={image.src}
        srcSet={image.srcSet}
        alt="Homepage"
        loading="lazy"
        css={styles}
        alt={alt}
      />
    </picture>
  );
}

const imageShape = PropTypes.shape({
  src: PropTypes.string.isRequired,
  srcSet: PropTypes.string,
  srcWebp: PropTypes.string,
  srcSetWebp: PropTypes.string
});

Image.propTypes = {
  image: imageShape.isRequired,
  desktopImage: imageShape
};
Here's how the home section component uses it:
function Home() {
  const { mobileImage, desktopImage } = getImageSources();

  return (
    <div id="home" css={styles.home}>
      <section css={styles.textContainer}>
        <section>
          <h1>Un beau sourire à Casablanca</h1>
          <p>Assuré par un soin dentaire de qualité depuis 30 ans</p>
        </section>
        <a className="button primary" href="#contact">
          Nous contacter
        </a>
      </section>
      <div css={styles.imageContainer}>
        <Image
          image={mobileImage}
          desktopImage={desktopImage}
          alt="Homepage"
          styles={styles.img}
        />
      </div>
    </div>
  );
}
For sections that require fetching a batch of images, we use the relativeDirectory filter in the GraphQL query to fetch all images in a certain directory and create a map of imageId -> imageData to use when rendering these images.
Here's an example of the query used to fetch images for the Reviews section:
 function getImagesMap() {
  const data = useStaticQuery(graphql`
    query {
      allFile(filter: { : { eq: "reviews" } }) {
        nodes {
          childImageSharp {
            fixed(width: 90) {
              ...GatsbyImageSharpFixed_withWebp_noBase64
            }
          }
          name
        }
      }
    }
  `);

  return imagesToMap(data.allFile.nodes);
}
And here's the body of imagesToMap :
function imagesToMap(images) {
  return images.reduce(
    (acc, { name, childImageSharp: { fixed } }) => ({ ...acc, [name]: fixed }),
    {}
  );
}
We then iterate through the images data and render them with our Image component:
function Reviews() {
  const imagesMap = getImagesMap();

    return (
        ...
        {data.map(review => (
          <Image
            alt={review.name}
            image={imagesMap[review.image]}
            styles={styles.img}
          />
        }
    ...
);
Let's check if images are optimized
All images are fetched in webp format and their sizes got dramatically reduced. The Network Tab shows the following:

We also see that images are lazy-loaded on scroll whenever they're close to appearing in the viewport:
Resulting performance
Now that all images issues are fixed, let's run Lighthouse again and check the website's performance:

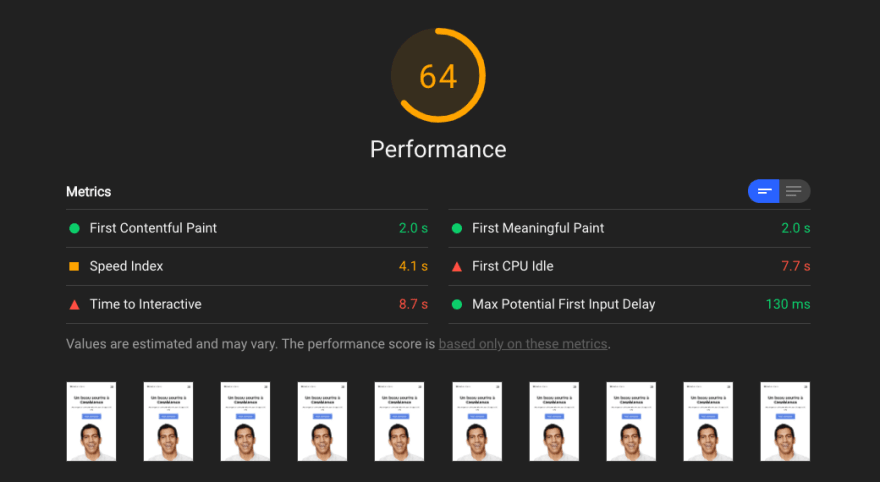

| Metric | Initial value | New value | Overall Progress |
|---|---|---|---|
| Performance | 54 | 63.3 | + 9.3 (+ 17%) |
| First Contentful Paint | 2.1 s | 1.8 s | - 0.3 s |
| Time to Interactive | 10.6 s | 9.2 s | - 1.4 s |
We solved the issues with images, which resulted in a noticeable performance improvement:
- The overall Performance improved by 17%.
- The First Contentful Paint is 300 ms faster.
- The Time to Interactive is 1.4 s faster.
Lazy-loading Google Maps
When we look at Lighthouse reported problems, we find an issue with the Google Maps used in the Contact section:

We see 2 problems:
- Google Maps scripts and images are not lazy-loaded.
- Google Maps images are not efficiently compressed since they're using either jpg or png.
Lazy-loading Google Maps when the user scrolls close enough to the Contact section should solve these issues.
To detect when an element (in our case the Contact section) appears in the viewport, we create a useInViewPort hook which leverages the power of IntersectionObserver to do its job:
const THRESHOLD = 0;

export default function useInViewPort() {
  let nodeRef = React.useRef(null);
  let observerRef = React.useRef(null);

  const [isVisible, setIsVisible] = React.useState(false);

  React.useEffect(() => {
    observerRef.current = new IntersectionObserver(
      entries => {
        setIsVisible(entries[0].isIntersecting);
      },
      { THRESHOLD }
    );

    observerRef.current.observe(nodeRef.current);

    return () => {
      observerRef.current.disconnect();
    };
  }, []);

  React.useEffect(() => {
    if (isVisible) {
      observerRef.current.disconnect();
    }
  }, [isVisible]);

  return [nodeRef, isVisible];
}
We then use it in the Contact section to lazy-load Google Maps:
function Contact() {
  const mapRef = React.useRef();
  const [nodeRef, isVisible] = useInViewport();

  function initialize() {
    new window.google.maps.Map(mapRef.current, mapOptions);
  }

  React.useEffect(() => {
    if (isVisible) {
      const script = document.createElement("script");
      script.src = `https://maps.googleapis.com/maps/api/js?key=${API_KEY}&language=fr`;
      script.addEventListener("load", initialize);
      document.body.appendChild(script);
    }
  }, [isVisible]);

  return (
    <div ref={nodeRef}>
            ...
        <section>
          <div ref={mapRef} css={styles.map}></div>
        </section>
            ...
    </div>
  );
}
Checking if Google Maps is lazy-loaded
We do so by checking the Network Tab while scrolling:
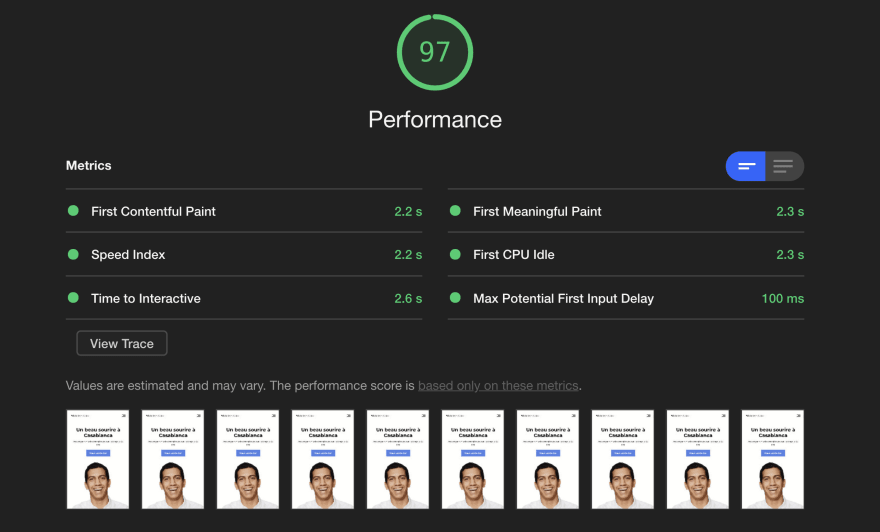
Measuring the new performance
Lighthouse gives the following new performance metrics:


| Metric | Initial value | New value | Overall Progress |
|---|---|---|---|
| Performance | 54 | 97.3 | + 43.3 (+ 80%) |
| First Contentful Paint | 2.1 s | 2.1 s | 0 |
| Time to Interactive | 10.6 s | 2.6 s | - 8 s |
Let's summarize what we achieved:
- We brought the page performance from 54 to 97.3 (an improvement of 80%).
- We reduced the time it takes for the page to be interactive by 8 s.
Improving font loading speed
When using the url provided by Google fonts to load fonts, we're actually loading a CSS file that loads a big number of variations of the font we want to use.
We can improve that by manually loading only the latin variations of the the fonts used in the page:
  @font-face {
    font-family: "Montserrat";
    font-style: normal;
    font-weight: 400;
    font-display: swap;
    src: local("Montserrat Regular"), local("Montserrat-Regular"),
      url(https://fonts.gstatic.com/s/montserrat/v14/JTUSjIg1_i6t8kCHKm459WlhyyTh89Y.woff2)
        format("woff2");
    unicode-range: U+0000-00FF, U+0131, U+0152-0153, U+02BB-02BC, U+02C6, U+02DA,
      U+02DC, U+2000-206F, U+2074, U+20AC, U+2122, U+2191, U+2193, U+2212,
      U+2215, U+FEFF, U+FFFD;
  }

  @font-face {
    font-family: "Montserrat";
    font-style: normal;
    font-weight: 500;
    font-display: swap;
    src: local("Montserrat Medium"), local("Montserrat-Medium"),
      url(https://fonts.gstatic.com/s/montserrat/v14/JTURjIg1_i6t8kCHKm45_ZpC3gnD_vx3rCs.woff2)
        format("woff2");
    unicode-range: U+0000-00FF, U+0131, U+0152-0153, U+02BB-02BC, U+02C6, U+02DA,
      U+02DC, U+2000-206F, U+2074, U+20AC, U+2122, U+2191, U+2193, U+2212,
      U+2215, U+FEFF, U+FFFD;
  }

  @font-face {
    font-family: "Montserrat";
    font-style: normal;
    font-weight: 700;
    font-display: swap;
    src: local("Montserrat Bold"), local("Montserrat-Bold"),
      url(https://fonts.gstatic.com/s/montserrat/v14/JTURjIg1_i6t8kCHKm45_dJE3gnD_vx3rCs.woff2)
        format("woff2");
    unicode-range: U+0000-00FF, U+0131, U+0152-0153, U+02BB-02BC, U+02C6, U+02DA,
      U+02DC, U+2000-206F, U+2074, U+20AC, U+2122, U+2191, U+2193, U+2212,
      U+2215, U+FEFF, U+FFFD;
  }
We also emphasize to the browser that we want to fetch these fonts as early as possible. To do so, we use the preload attribute in the links used to load the fonts:
        <link
          rel="preload"
          as="font"
          href="https://fonts.gstatic.com/s/montserrat/v14/JTUSjIg1_i6t8kCHKm459WlhyyTh89Y.woff2"
          crossOrigin="true"
        />
        <link
          rel="preload"
          as="font"
          href="https://fonts.gstatic.com/s/montserrat/v14/JTURjIg1_i6t8kCHKm45_ZpC3gnD_vx3rCs.woff2"
          crossOrigin="true"
        />
        <link
          rel="preload"
          as="font"
          href="https://fonts.gstatic.com/s/montserrat/v14/JTURjIg1_i6t8kCHKm45_ZpC3gnD_vx3rCs.woff2"
          crossOrigin="true"
        />
We also use <link rel=preconnect> to emphasize to the browser the priority of these fonts when loading resources:
<link rel="preconnect" href="https://fonts.gstatic.com/s/montserrat/" />
The final test
Running Lighthouse after this gives the following results:


| Metric | Initial value | New value | Overall Progress |
|---|---|---|---|
| Performance | 54 | 97.3 | + 43.3 (+ 80%) |
| First Contentful Paint | 2.1 s | 1.8 s | - 0.3 s |
| Time to Interactive | 10.6 s | 2.9 s | - 7.7 s |
- We brought the page performance from 54 to 97.3 (an improvement of 80%).
- We reduced the First Contentful Paint by 300 ms.
- We reduced the time it takes for the page to be interactive by 7.7 s.
Looking back at the competition
Here's how we're performing now compared to the rest of the competition:

Compared to its fastest competitor (C), Sbaï Dentaire overall performance score is 32% higher and its Time to Interactive is almost 3 times faster.
Note: we'd love to help you improve or build blazing fast web pages. Get in touch with us.


Top comments (0)