The Jaeger tracing system is an open-source tracing system for microservices, and it supports the OpenTracing standard. We talked about OpenTracing and why it's essential in a previous post. So now, let's talk more about Jaeger.
Jaeger was initially published as open source by Uber Technologies and has evolved since then. The system gives you distributing tracing, root cause analysis, service dependency analysis, and more.
We're going get started with Jaeger tracing by installing it and using it to examine some RESTful API calls to a single microservice. To do this, we'll need to build a small service with tracing enabled. Jaeger has tooling for Go, Java, JavaScript (Node.js,) Python, and C++. We'll use Java for this tutorial, but the concepts we cover here will apply to any supported platform.

Installation and Setup
Docker
The preferred way to install and run Jaeger tracing is with Docker. It's also the easiest. So if you're not running Docker yet, take a look at the installation process for your platform here. The Community Edition is more than adequate for this tutorial.
Install Jaeger
Jaeger is a set of distributed components for collecting, storing, and displaying trace information. But it also ships as an "all-in-one" image that runs the entire system. We'll use that to keep the install simple for this tutorial. There are instructions for getting started here, but I'll cover a condensed version in this post.
Docker will download the image for you when you try to start a container. I'll use a shorter command line than the one in Jaeger's instructions because we're only going to use one of the system's tracing modes.
docker run -d --name jaeger -p 16686:16686 -p 6831:6831/udp jaegertracing/all-in-one:1.9
So, when you run the container, your command should look like this.
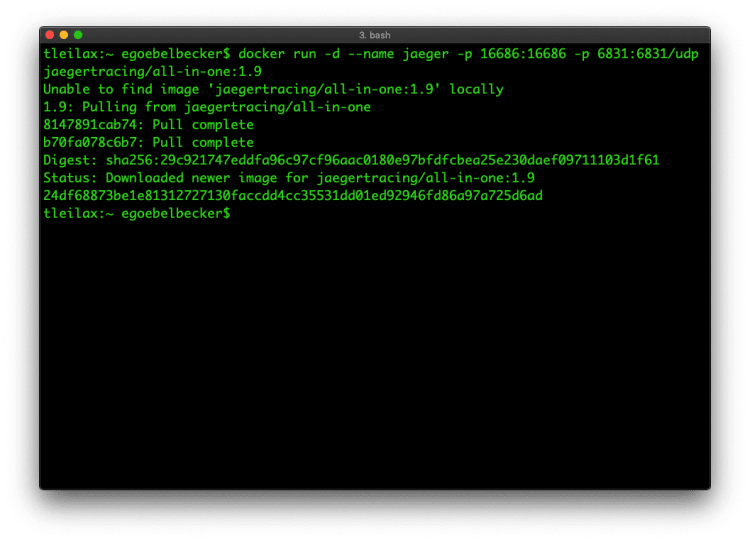
When the command finishes, check to see if the server is running with docker ps -a

You should see the container name, jaeger, with up in the status column. You'll also see a lot of information about service ports.
Now, you can connect to the Jaeger console at http://localhost:16686

We see the Jaeger user interface. It's running!
Java Microservice
We'll use a simple Spring Boot service to create some traces. The code for the project is on GitHub.
The project has scripts for running the service via script or in a container. If you want to run both the service and Jaeger in containers, you'll need to know how to get them to connect over UDP using Docker networking. That's beyond the scope of this tutorial.
Jaeger and Open Tracing Concepts
Before we start our service, we can take a look at Jaeger's interface and review some basic open tracing concepts. The user interface service reports its queries so that we can see examples of a few basic traces.

Look at the box on the left-hand side of the page labeled Find Traces. The first control, a chooser, lists the services available for tracing. The count should show one. (If it doesn't, try refreshing the page.) Now, click the chooser and you'll see jaeger-query listed as the only service.
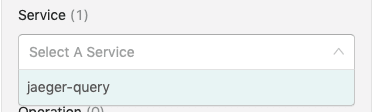
A service is an application that's registered itself to Jaeger. We'll see how to register our application below.
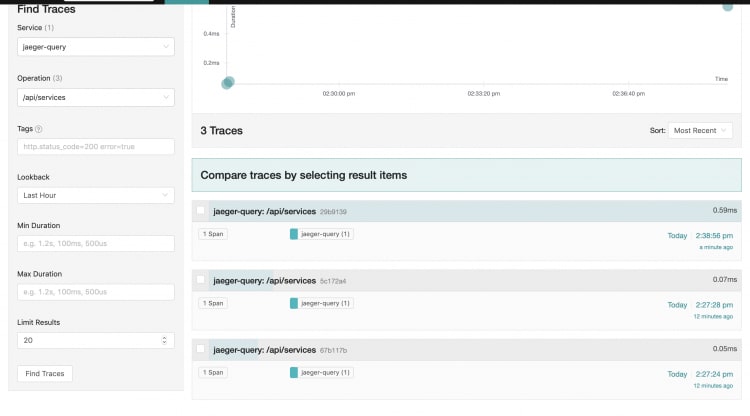
Next, with jaeger-query selected, click the Find Traces button on the bottom of the form.

A list of traces will appear on the right-hand side of the screen. The traces have titles that correspond to the Operation selector on the search form. So, select /api/services in the Operation box and click the Find button again. Depending on how many times you reloaded the page, you'll see a few operations.
Now click on one of the traces.
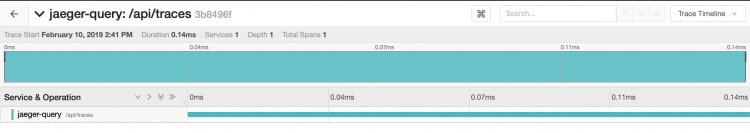
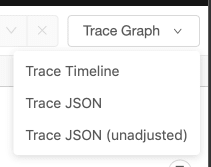
This trace has one operation in it. It took 0.14 ms. There's not much to look at here. But we can look at what the service sent to the Jaeger Tracing server. So click on the box in the upper right-hand side of the page.
Jaeger Tracing Tags
Next, let's look at the JSON.
{
  "data": [
    {
      "traceID": "3b8496f91e044c34",
      "spans": [
        {
          "traceID": "3b8496f91e044c34",
          "spanID": "3b8496f91e044c34",
          "flags": 1,
          "operationName": "/api/traces",
          "references": [],
          "startTime": 1549827709524283,
          "duration": 142,
          "tags": [
            {
              "key": "sampler.type",
              "type": "string",
              "value": "const"
            },
            {
              "key": "sampler.param",
              "type": "bool",
              "value": true
            },
            {
              "key": "span.kind",
              "type": "string",
              "value": "server"
            },
            {
              "key": "http.method",
              "type": "string",
              "value": "GET"
            },
            {
              "key": "http.url",
              "type": "string",
              "value": "/api/traces?end=1549827709522000\u0026limit=20\u0026lookback=1h\u0026maxDuration\u0026minDuration\u0026service=jaeger-query\u0026start=1549824109522000\u0026tags=%7B%22http.status_code%22%3A%22404%22%7D"
            },
            {
              "key": "component",
              "type": "string",
              "value": "net/http"
            },
            {
              "key": "http.status_code",
              "type": "int64",
              "value": 200
            }
          ],
          "logs": [],
          "processID": "p1",
          "warnings": null
        }
      ],
      "processes": {
        "p1": {
          "serviceName": "jaeger-query",
          "tags": [
            {
              "key": "client-uuid",
              "type": "string",
              "value": "6550fb460c8ee430"
            },
            {
              "key": "hostname",
              "type": "string",
              "value": "9f77a41dfd0c"
            },
            {
              "key": "ip",
              "type": "string",
              "value": "172.17.0.2"
            },
            {
              "key": "jaeger.version",
              "type": "string",
              "value": "Go-2.15.1dev"
            }
          ]
        }
      },
      "warnings": null
    }
  ],
  "total": 0,
  "limit": 0,
  "offset": 0,
  "errors": null
}
There's a lot of information here. Toward the top of the JSON, you see an array of spans. This trace only has one. A trace consists of one or more spans. A span is, as you might guess, an interval of time that contains one or more operations. We'll take a closer look at spans when we add some code to the Java service.
Inside the span, there's an array of tags. Tags are attributes an application adds to traces. Here are two:
{
    "key": "http.method",
    "type": "string",
    "value": "GET"
},
{
    "key": "http.status_code",
    "type": "int64",
    "value": 200
}
We'll see how to add these tags to our spans below. For now, let's go back to the main page and use tags to search.
Now enter http.method=get in the Tags field and click the find button again.

You'll see a list of traces. Most of the operations in the Jaeger UI are GETS, which makes sense.
That's the basics of the Jaeger interface. Let's connect a service.
Tracing a Service
The Jaeger tutorial application contains a create-read-update-delete (CRUD) API for managing employee records. The records are stored in a local hashmap. We're going to add a trace with two spans to the application.
Creating a Tracer
To add tracing to an application, you need a Tracer. We'll create one and use Spring to supply it to the microservice's service and controller classes.
Here's the method for creating the tracer:
@Bean
public static JaegerTracer getTracer() {
    Configuration.SamplerConfiguration samplerConfig = Configuration.SamplerConfiguration.fromEnv().withType("const").withParam(1);
    Configuration.ReporterConfiguration reporterConfig = Configuration.ReporterConfiguration.fromEnv().withLogSpans(true);
    Configuration config = new Configuration("jaeger tutorial").withSampler(samplerConfig).withReporter(reporterConfig);
    return config.getTracer();
}
The first step is constructing configuration classes. You use them to create the Tracer. Jaeger has an extensive set of tools for configuration. We're accepting the default settings and naming our tracer jaeger tutorial.
This method is in the class with the service's main method. We're treating it like a Spring Bean and injecting into the constructors of the controller and service classes. If you don't understand Spring dependency injection, you can assume that the controller and service methods have access to a tracer.
You can learn more about Jaeger configuration here and here.
Tracing a REST API Call
Let's start with adding a single span to a POST method. Here's our code for adding a new employee.
@ApiOperation(value = "Create Employee ", response = ResponseEntity.class)
@RequestMapping(value = "/api/tutorial/1.0/employees", method = RequestMethod.POST)
public ResponseEntity createEmployee(@RequestBody Employee employee) {

    // Create a span
    Span span = tracer.buildSpan("create employee").start();

    HttpStatus status = HttpStatus.FORBIDDEN;

    log.info("Receive Request to add employee {}", employee);
    if (employeeService.addEmployee(employee)) {
        status = HttpStatus.CREATED;

        // Set http status code
        span.setTag("http.status_code", 201);
    } else {
        span.setTag("http.status_code", 403);
    }

    // Close the span
    span.finish();
    return new ResponseEntity(null, status);
}
We create a Span at the start of the method, using our Tracer instance. Then we set a tag corresponding to the HTTP status code of the request. This should make out trace look a lot like the Jaeger query service. The service has a Swagger interface, so we can use it to add an employee.

Fill out details for an employee and then click the Try it out! button twice. The first request will succeed. The second will fail because the service will not accept a new employee with an existing ID.
Now, take a look at the Jaeger search page. Select jaeger tutorial in the service selector and create employee in the operation selector and click the find button.
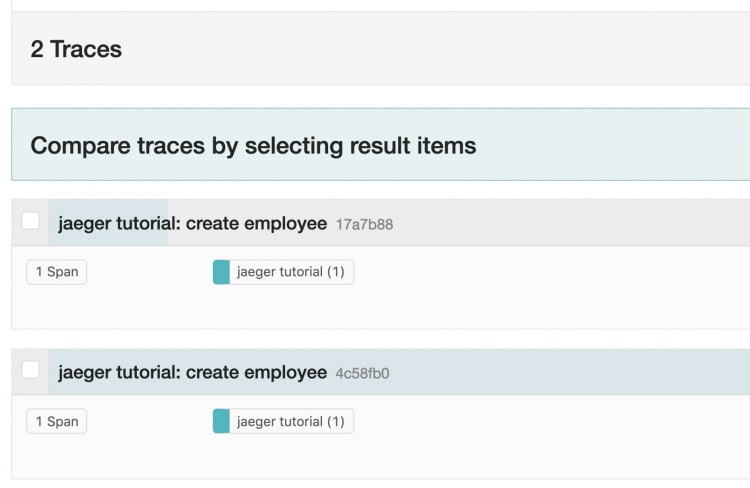
We see two traces, but we know one failed and one succeeded. Let's refine the search. Enter http.status_code=403 in the Tags text box.

Now, click the find button again. You'll see only one trace. Tags are useful for filtering traces and looking at specific criteria.
Multiple Spans and Log Messages
Let's finish up by adding a second span to a trace, along with log messages.
Here is the controller's delete method:
@ApiOperation(value = "Delete Employee ", response = ResponseEntity.class)
@RequestMapping(value = "/api/tutorial/1.0/employees/{id}", method = RequestMethod.DELETE)
public ResponseEntity deleteEmployee(@PathVariable("id") String idString) {

    Span span = tracer.buildSpan("delete employee").start();

    HttpStatus status = HttpStatus.NO_CONTENT;

    try {
        int id = Integer.parseInt(idString);
        log.info("Received Request to delete employee {}", id);
        span.log(ImmutableMap.of("event", "delete-request", "value", idString));
        if (employeeService.deleteEmployee(id, span)) {
            span.log(ImmutableMap.of("event", "delete-success", "value", idString));
            span.setTag("http.status_code", 200);
            status = HttpStatus.OK;
        } else {
            span.log(ImmutableMap.of("event", "delete-fail", "value", "does not exist"));
            span.setTag("http.status_code", 204);
        }
    } catch (NumberFormatException | NoSuchElementException nfe) {
        span.log(ImmutableMap.of("event", "delete-fail", "value", idString));
        span.setTag("http.status_code", 204);
    }

    span.finish();
    return new ResponseEntity(null, status);
 }
Like the add method, we're opening a span at the start of the method. We're also setting the status code tag based on the result of the delete request. Also, the code has log messages based on the outcome of the query.
We're also passing our Span object to the service. Let's look at why. Here is the delete method in the service:
public boolean deleteEmployee(int id, Span rootSpan) {

    Span span = tracer.buildSpan("service delete employee").asChildOf(rootSpan).start();

    boolean result = false;
    if (employeeMap.containsKey(id)) {
        employeeMap.remove(id);
        result = true;
    }
    span.finish();
    return result;
}
We're creating a new span inside the method, setting it as a child of the span that was passed in.
Run the service and try to delete a valid employee and then an invalid one.
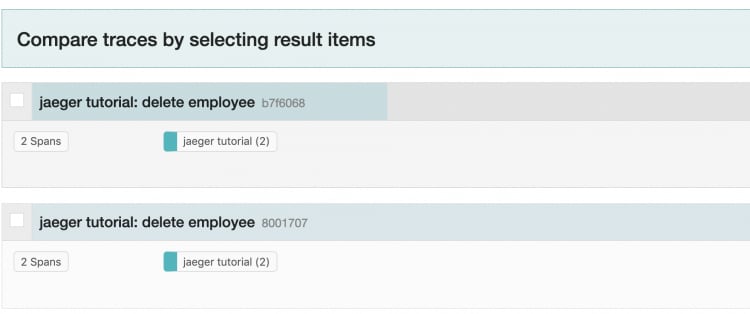
Now, select delete employee in the operation control and click the find button.

You should see two operations with two spans each.
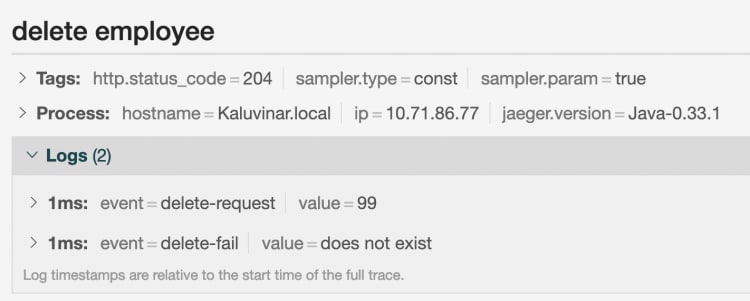
Inspect each trace, and you'll see a few new things. Here's the successful trace, with both spans displayed:

You can see the second trace and the log messages. The failed delete has different log messages.
So, with a few lines of code, we can see how long operations take and get an idea of why!
Jaeger Tracing for Microservices
Jaeger tracing is an open-source implementation of the OpenTracing standard. In just a few minutes we installed the system and used it to trace a REST microservice. Tracing is an essential strategy for managing your services and monitoring your users' experience, so enjoy the fruits of this new knowledge!

Top comments (0)