Preface
This article is to visualize the behavior of the Linux kernel. Specifically, it visualize the behavior of Linux's process scheduler.
Many people know the concept of round-robin scheduling, but, how many people actually confirmed that processes are really scheduled as this way? You can confirm it with fancy kernel features like ftrace. However, this article does it with a simple userland program, without the deep knowledge about OS kernels.
The Measurement Program
This article uses a measurement program, called sched. This program launches the one ore more worker processes and waits for the termination of worker processes. Each worker processes consumes some CPU time and exit after that.
This specification of this program is as follows.
-
schednproc total resolution - The meaning of the command line arguments is as follows.
- nproc(1st argument): the number of processes running in parallel
- total(2nd argument): the CPU time which each process consumes in milliseconds
- resolution(3rd argument): the measurement interval in milliseconds
- The meaning of the output of this program is as follows.
- One entry per one measurement point
- The meaning of each measurement point is as follows.
- 1st field: the ID of each worker thread
- 2nd field: elapse time from the start time
- 3rd field: the progress of worker thread in percentage, in other words,
already consumed CPU time/<total>
Here is the source code.
#include <sys/types.h>
#include <sys/wait.h>
#include <time.h>
#include <unistd.h>
#include <stdio.h>
#include <stdlib.h>
#include <string.h>
#include <err.h>

#define NLOOP_FOR_ESTIMATION 1000000000UL
#define NSECS_PER_MSEC 1000000UL
#define NSECS_PER_SEC 1000000000UL

static inline long diff_nsec(struct timespec before, struct timespec after)
{
        return ((after.tv_sec * NSECS_PER_SEC + after.tv_nsec)
                - (before.tv_sec * NSECS_PER_SEC + before.tv_nsec));

}

static unsigned long loops_per_msec()
{
        struct timespec before, after;
        clock_gettime(CLOCK_MONOTONIC, &before);

        unsigned long i;
        for (i = 0; i < NLOOP_FOR_ESTIMATION; i++)
        ;

        clock_gettime(CLOCK_MONOTONIC, &after);

    int ret;
        return  NLOOP_FOR_ESTIMATION * NSECS_PER_MSEC / diff_nsec(before, after);
}

static inline void load(unsigned long nloop)
{
        unsigned long i;
        for (i = 0; i < nloop; i++)
                ;
}

static void child_fn(int id, struct timespec *buf, int nrecord, unsigned long nloop_per_resol, struct timespec start)
{
        int i;
        for (i = 0; i < nrecord; i++) {
                struct timespec ts;

                load(nloop_per_resol);
                clock_gettime(CLOCK_MONOTONIC, &ts);
                buf[i] = ts;
        }
        for (i = 0; i < nrecord; i++) {
                printf("%d\t%ld\t%d\n", id, diff_nsec(start, buf[i]) / NSECS_PER_MSEC, (i + 1) * 100 / nrecord);
        }
        exit(EXIT_SUCCESS);
}

static void parent_fn(int nproc)
{
        int i;
        for (i = 0; i < nproc; i++)
                wait(NULL);
}

static pid_t *pids;

int main(int argc, char *argv[])
{
        int ret = EXIT_FAILURE;

        if (argc < 4) {
                fprintf(stderr, "usage: %s <nproc> <total[ms]> <resolution[ms]>\n", argv[0]);
                exit(EXIT_FAILURE);
        }

        int nproc = atoi(argv[1]);
        int total = atoi(argv[2]);
        int resol = atoi(argv[3]);

        if (nproc < 1) {
                fprintf(stderr, "<nproc>(%d) should be >= 1\n", nproc);
                exit(EXIT_FAILURE);
        }

        if (total < 1) {
                fprintf(stderr, "<total>(%d) should be >= 1\n", total);
                exit(EXIT_FAILURE);
        }

        if (resol < 1) {
                fprintf(stderr, "<resol>(%d) should be >= 1\n", resol);
                exit(EXIT_FAILURE);
        }

        if (total % resol) {
                fprintf(stderr, "<total>(%d) should be multiple of <resolution>(%d)\n", total, resol);
                exit(EXIT_FAILURE);
        }
        int nrecord = total / resol;

        struct timespec *logbuf = malloc(nrecord * sizeof(struct timespec));
    if (!logbuf)
        err(EXIT_FAILURE, "malloc(logbuf) failed");

    puts("estimating workload which takes just one milisecond");
        unsigned long nloop_per_resol = loops_per_msec() * resol;
    puts("end estimation");
    fflush(stdout);

        pids = malloc(nproc * sizeof(pid_t));
        if (pids == NULL) {
                warn("malloc(pids) failed");
                goto free_logbuf;
        }

        struct timespec start;
        clock_gettime(CLOCK_MONOTONIC, &start);

        int i, ncreated;
        for (i = 0, ncreated = 0; i < nproc; i++, ncreated++) {
                pids[i] = fork();
                if (pids[i] < 0) {
                        goto wait_children;
                } else if (pids[i] == 0) {
                        // children

                        child_fn(i, logbuf, nrecord, nloop_per_resol, start);
                        /* shouldn't reach here */
                }
        }
        ret = EXIT_SUCCESS;

        // parent

wait_children:
        if (ret == EXIT_FAILURE)
                for (i = 0; i < ncreated; i++)
                        if (kill(pids[i], SIGINT) < 0)
                                warn("kill(%d) failed", pids[i]);

        for (i = 0; i < ncreated; i++)
                if (wait(NULL) < 0)
                        warn("wait() failed.");

free_pids:
        free(pids);

free_logbuf:
        free(logbuf);

        exit(ret);
}
How to measure
I used the following bash script named capture to get the data.
#!/bin/bash

NCPU=$(grep -c processor /proc/cpuinfo)
LASTCPU=$(($NCPU - 1))
PATTERN="1 2 3 4"
TOTAL_US=1000
RESOL_US=10

for i in ${PATTERN} ; do
    taskset --cpu-list ${LASTCPU} ./sched $i ${TOTAL_US} ${RESOL_US} >$i.txt
done
With this script, I got the data of the following conditions.
- the number of CPUs which
schedruns on: 1 - the arguments of
sched- nproc: 1, 2, 3, 4
- total: 1000
- resolution: 10
I run configure as follows.
$ make sched
$ ./capture
Hardware/Software Environment
- CPU: Intel(R) Core(TM) i5-2400 CPU @ 3.10GHz x 1 (4 core 1 thread)
- OS: Debian GNU/Linux stretch
- kernel: 4.8.0-1-amd64
The Measurement Result
I make the two graphs for each nproc as follows.
-
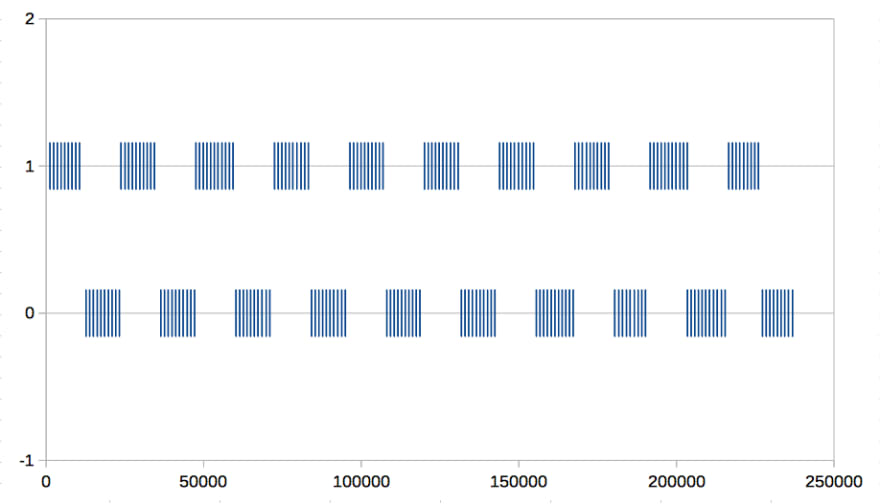
graph1: What worker thread running on CPU
- x-axis: the elapsed time from the start time in microseconds
- y-axis: the ID of each worker threads
-
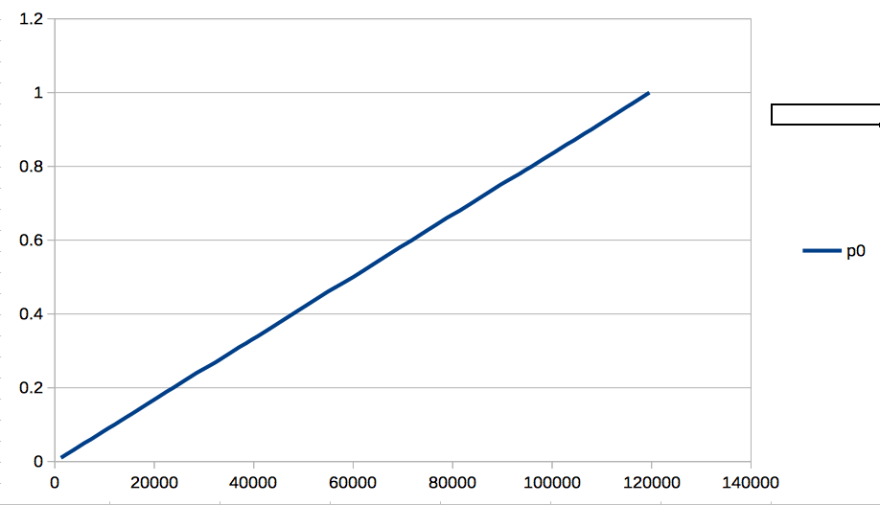
graph2: the progress of worker threads
- x-axis: the same as the graph1
- y-axis: the progress of worker threads. 0 means 0 percent and 1 means 100 percent.
nproc == 1
- graph1

- graph2
nproc == 2
- graph1
- graph2

nproc == 3
- graph1

- graph2

nproc == 4
- graph1

- graph2

Consideration
You found the following things from the measurement result.
- Only one worker process can run at the same time
- each worker thread runs as round-robin way
Conclusion
By this article, you found Linux schedules processes in a round-robin way. If you're interested in the result, please confirm the following things.
- How the timeslice of each worker processes are changed if nproc is changed
- How about the result if you run
schedwithout pinning each worker threads to only one CPU. - How the timeslice of each worker processes are changed if the nice value of them are changed

Top comments (0)