i want to create chart like this on :

but the stacked aren't straight :
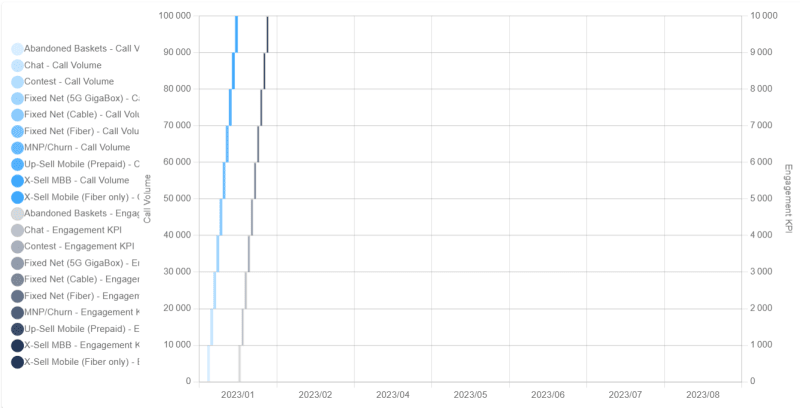
this is my code :
import React from 'react';
import { Bar } from 'react-chartjs-2';
import { Chart as ChartJS, BarElement, CategoryScale, Tooltip, Legend, LinearScale } from 'chart.js';
ChartJS.register(BarElement, CategoryScale, LinearScale, Tooltip, Legend);
const StackedBar = () => {
const categories = [
'Abandoned Baskets',
'Chat',
'Contest',
'Fixed Net (5G GigaBox)',
'Fixed Net (Cable)',
'Fixed Net (Fiber)',
'MNP/Churn',
'Up-Sell Mobile (Prepaid)',
'X-Sell MBB',
'X-Sell Mobile (Fiber only)',
];
const callVolumeData = categories.map((category, index) => ({
label: ${category} - Call Volume,
data: [10000], // Replace with actual call volume data
backgroundColor: rgba(64, 169, 252, ${0.1 + (index + 1) * 0.1}), // Shades of blue
yAxisID: 'y1',
}));
const engagementData = categories.map((category, index) => ({
label: ${category} - Engagement KPI,
data: [1000],
backgroundColor: rgba(37, 56, 88, ${0.1 + (index + 1) * 0.1}), // Shades of blue
yAxisID: 'y2',
borderWidth: 1,
circular: true
}));
const data = {
labels: ['2023/01', '2023/02', '2023/04', '2023/05', '2023/06', '2023/07', '2023/08'],
datasets: [...callVolumeData, ...engagementData],
};
const options = {
plugins: {
legend:{
display:true,
position: 'left',
labels: {
usePointStyle: true,
boxWidth: 6
}
},
title: {
display: true,
text: 'Chart.js Bar Chart - Side by Side',
},
},
scales: {
  x: {
    barPercentage: 3  ,
    categoryPercentage: 0.6
  },
  y1: {
    position: 'left',
    title: {
      display: true,
      text: 'Call Volume',
    },
    stacked: true,

  },
  y2: {

    position: 'right',
    title: {
      display: true,
      text: 'Engagement KPI',
    },
    stacked: true,
  },
},
};
return ;
};
export default StackedBar;


Top comments (0)