In the last article,
We have gone through set-up, selections and append(updated) in d3js. This article we will learn svg elements. Scalable Vector Graphics(SVG) is the building blocks of 2D data visualization on the web. It is an XML-based markup language for describing two dimensional based vector graphics. SVG has now become mainstream and widely supported.
Lets create a svg with tag <svg></svg>
By default svg takes up 300px width and 150px height if not declared. You can declare width and height either as attributes or style element.
ex: <svg width="500px" height="500px"></svg>
click on HTML, CSS or JS tabs to look at the code
Now think of svg as 500x500 pixel grid where we will place elements using these grid co-ordinates.
Lets try to make basic shapes onto SVG
Line
A line requires 2 points start and end, start as x1,y1 and end as x2,y2.
Any element in svg needs to have a stroke color in order to show up on the screen
ex: <line x1="100" y1="100" x2="400" y2="400" stroke="black"/>
click on HTML, CSS or JS tabs to look at the code
Creating a line with d3
**`d3.line()`**
click on HTML, CSS or JS tabs to look at the code
We initialize a line generator using d3.line() and then call it by passing our data to it. Line generator will loop through the data array to get x and y values and then generate path data. Which we can pass to d attribute of path. We will learn more about line generators in coming articles.
Now you may be wondering why we have appended a path instead of line. So basically path can take up any shape, so people at d3 used path for most of the elements to make it less complex. I showed the example of <line> tag to make it easy to understand how things are placed in SVG.
Click on edit on codepen on top right corner of the codepen example and un-comment the second data variable and comment out first data variable and check how the line is shaped, which we cannot achieve with the single line tag.
While building data visuals, there will be times where you want to statically place shapes for which you dont need a generator function. So its better to know the basic shapes.
There are 6 shape tags in svg
- Line ->
<line x1="0" y1="0" x2="200" y2="200" /> - Rectangle ->
<rect x="50" y="20" width="150" height="150" >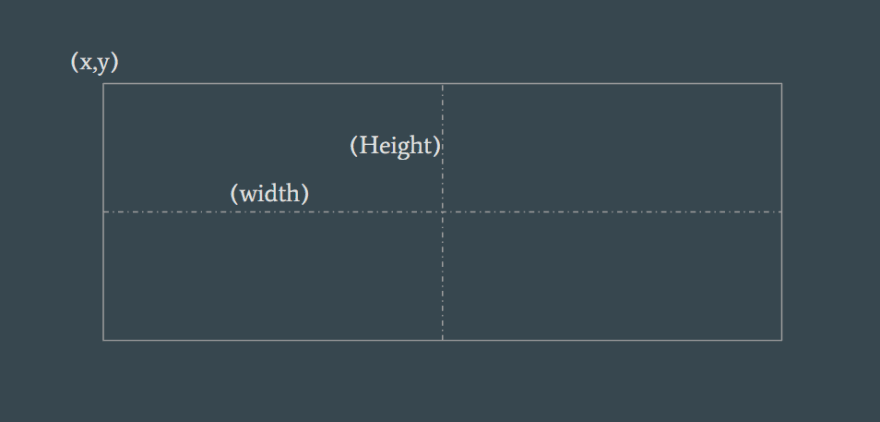
- Circle ->
<circle cx="50" cy="50" r="50"/>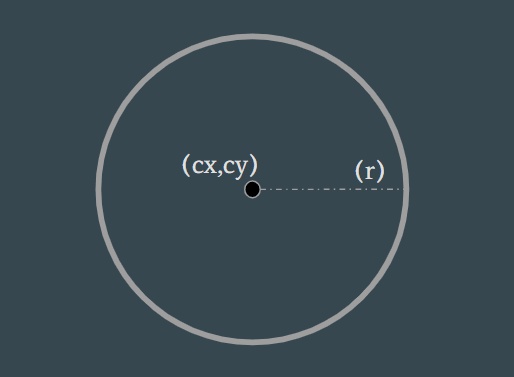
- Ellipse ->
<ellipse cx="200" cy="80" rx="100" ry="50" />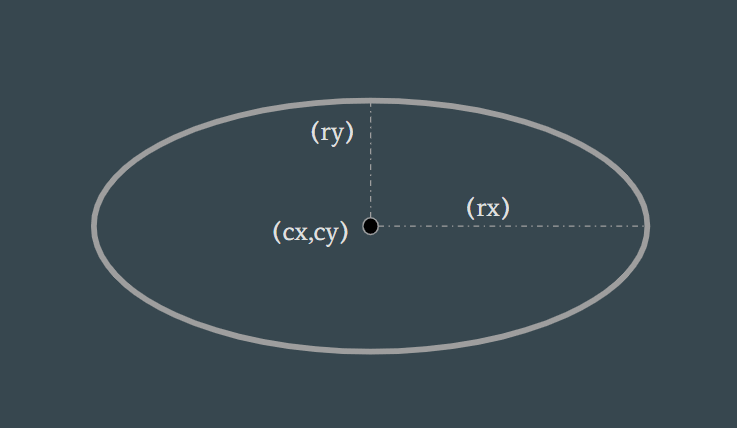
- Polygon ->
<polygon points="220,10 300,210 170,250 123,234" />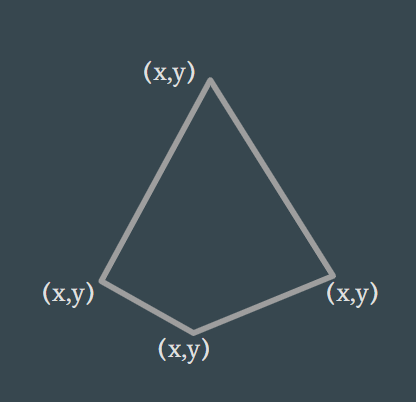
- Polyline ->
<polyline points="20,20 40,25 60,40 80,120 120,140 200,180" />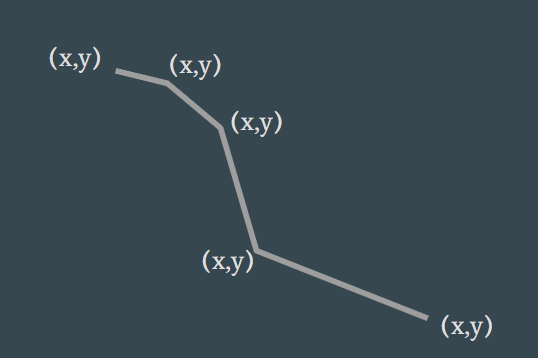
and
- Path -> which can take up any shape, Which we will discuss further
and
- Group ->
<g>Its like a div for svg, which is used to grouping multiple elements and manipulating. - Text ->
<text x="0" y="15" >I love SVG!</text>is used to place text
There are many elements for SVG. If you want to know more about SVG shapes, head on to MDN SVG elements
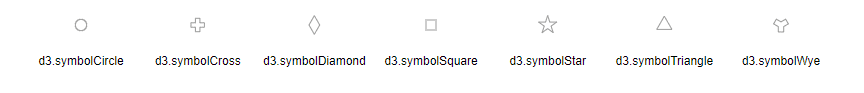
d3js also provide basic shape generator
Which you check out here
In next article we will go details about how path works.

Oldest comments (0)