
Cover image courtesy of rawpixel on Unsplash.
Background
In the middle of August, Dev.to opened up a survey entitled "The State of the Web" where they asked a bunch of questions concerning web technologies, demographics info, and the really important questions like, "Are you a Cat Person, a Dog Person, or [a Sociopath]?"
Note: some people have legitimate excuses to not like either cats or dogs, such as allergies or phobias. These people are not sociopaths. Also, the sociopath wording was not actually part of the survey, but added by me now.
Thanks to @ben, I found out that they had released the raw results, and I thought it would be fun to explore the data! While you can see the full analysis notebook I ended up with, I thought I would share the plots and some of the insights here. I'll try to follow the order of the original survey, for sanity.
Another note: I kind of skipped around during my analysis and picked up on only the things that I was interested in. Just a heads up, some of the data didn't get much attention from me.
I won't share all of my analysis code here, but I did want to share this setup cell:
# MF DEV PLOT COLOR PALETTE
sns.set_palette([
    '#83ACDD',
    '#FFA9CE',
    '#FF8287',
    '#FFE585',
    '#EEF692',
    '#00CAAF',
])
A third note: I'm really sorry about the image quality. I was having some funky things happen. And then I had nice SVG's, but had issues uploading them onto Dev.to. Just, pretend they're not teeny tiny and hard to read. Look at the pretty colors.
Internet Speed
What is your typical Internet connection speed?
I was expecting these results to be more interesting than they were. It ended up being basically exactly what you would expect.

It was surprising to me that there were very many people less than .5 mbps (we salute you), but what was more surprising were the number of people who had no idea what their internet speed was. Almost 200! But, in the DEV spirit, it doesn't do anyone any good to mock. We'll use this as a teaching moment!
People: if you open your browser and search for "Speed Test," you can run one right there! Go forth with your newfound speed knowledge! And pester your internet company to provide you the actual service you're paying for.
Rating Questions
For the following section, indicate how strongly you agree with the following statements (scale of 0-10).
For this section I didn't come up with any plots. The results were pretty believable for a bunch of data points between 0 and 10: average around 5, with a pretty tight distribution -- standard deviation of about 2, meaning most points between 3 and 7. Here's a huge table summary of the data. #lazydatascientist
| Statistic | 5. Web innovation is outpacing native | 6. I am satisfied with the state of browser tooling for web dev | 7. Building for the web is becoming easier over time | 8. I feel safe while browsing the web | 9. I am satisfied with browser standards adoption | 10. The web is improving for end-users | 11. I am satisfied with the communication between the software side and the business side of my organization | 12. I am satisfied with the communication between the design side and the engineering side of my organization | 13. I am satisfied with the state of analytics tooling for the web | 14. I am satisfied with the state of a/b test tooling for the web | 15. I am satisfied with the current user interface design trends for the web | 16. I am familiar with the laws associated with GDPR | 17. The desktop web is typically slow and sluggish | 18. Accessibility is an important concern in my web development | 19. The mobile web is typically slow and sluggish | 20. I dislike ads on the web | 21. I am optimistic about the future of progressive web apps | 22. Artificial intelligence advancements are having a big impact on the web | 23. I am satisfied with the development libraries my team and I use |
|---|---|---|---|---|---|---|---|---|---|---|---|---|---|---|---|---|---|---|---|
| Count | 1827.000000 | 1860.000000 | 1875.000000 | 1885.000000 | 1866.000000 | 1876.000000 | 1796.000000 | 1783.000000 | 1756.000000 | 1618.000000 | 1817.000000 | 1841.000000 | 1849.000000 | 1857.000000 | 1853.000000 | 1870.000000 | 1826.000000 | 1822.000000 | 1815.000000 |
| Mean | 6.787630 | 6.522581 | 6.670933 | 5.488594 | 5.945338 | 7.263859 | 5.553452 | 6.113292 | 5.886674 | 5.428925 | 6.456247 | 5.424226 | 4.245538 | 6.180398 | 5.704803 | 8.594652 | 7.467141 | 5.986279 | 6.561983 |
| Std dev | 2.098557 | 2.110204 | 2.645748 | 2.598894 | 2.160630 | 2.248364 | 2.651312 | 2.460817 | 2.196922 | 2.065460 | 2.253823 | 3.077238 | 2.606033 | 2.739062 | 2.410552 | 2.091378 | 2.274881 | 2.680154 | 2.249682 |
| Min | 0.000000 | 0.000000 | 0.000000 | 0.000000 | 0.000000 | 0.000000 | 0.000000 | 0.000000 | 0.000000 | 0.000000 | 0.000000 | 0.000000 | 0.000000 | 0.000000 | 0.000000 | 0.000000 | 0.000000 | 0.000000 | 0.000000 |
| 25% | 5.000000 | 5.000000 | 5.000000 | 4.000000 | 5.000000 | 6.000000 | 4.000000 | 5.000000 | 5.000000 | 5.000000 | 5.000000 | 3.000000 | 2.000000 | 4.000000 | 4.000000 | 8.000000 | 6.000000 | 4.000000 | 5.000000 |
| 50% | 7.000000 | 7.000000 | 7.000000 | 6.000000 | 6.000000 | 8.000000 | 6.000000 | 6.000000 | 6.000000 | 5.000000 | 7.000000 | 6.000000 | 4.000000 | 7.000000 | 6.000000 | 10.000000 | 8.000000 | 6.000000 | 7.000000 |
| 75% | 8.000000 | 8.000000 | 9.000000 | 8.000000 | 8.000000 | 9.000000 | 8.000000 | 8.000000 | 7.000000 | 7.000000 | 8.000000 | 8.000000 | 6.000000 | 8.000000 | 7.000000 | 10.000000 | 9.000000 | 8.000000 | 8.000000 |
| Max | 10.000000 | 10.000000 | 10.000000 | 10.000000 | 10.000000 | 10.000000 | 10.000000 | 10.000000 | 10.000000 | 10.000000 | 10.000000 | 10.000000 | 10.000000 | 10.000000 | 10.000000 | 10.000000 | 10.000000 | 10.000000 | 10.000000 |
In general, DEVs are pretty optimistic!
The one that stood out to me was "I dislike ads on the web." Over 75% of people strongly agreed with that statement. 104 people disagreed with that statement! If you are one of those hundred, message/comment to me, because I'm honestly very interested to know why you don't dislike ads.
Multiple Answers
Which software development roles do you assume on a regular basis?
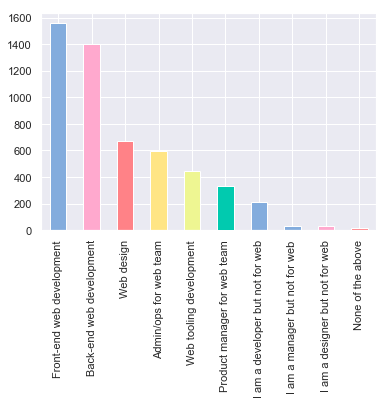
A pretty healthy spread!
Which of these front-end JavaScript framesworks do you currently work with?
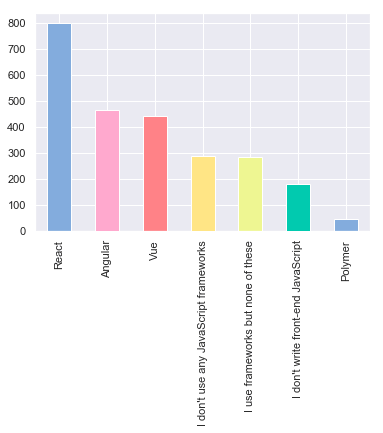
The people who don't use any framework at all (which includes me most the time, actually) make up about 15% of the total.
When working with CSS, which of the following do you make use of?

More people are using Flexbox than are using any type of preprocessor! Mind. Blown. Again, I'm very interested. If you don't use a css preprocessor like Sass or Less or Stylus, let me know why not!
And CSS Grid is making its way up in popularity, which is nice to see. Because it's awesome.
About 10% don't work with CSS at all. If you don't work with CSS by choice, that's totally fine, but if you don't use it because it's intimidating or hard or you hate it, and you want help, shoot me a message and I'd be happy to help however I can. I love CSS -- it's hard, but I really enjoy it!
Yes/No Questions
On this one, the data is less interesting than the cool graph I came up with to display it. Stacked HBar!

Personally, I was surprised by the lack of people doing TDD, and the amount of people that think browsers should force people to accept JavaScript.
Age vs. Years in Software
I combined two questions on this one:
What is your age in years?
How long have you been working in software, in years?
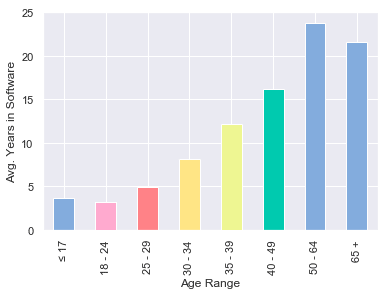
This is a pretty neat graph! High five to those few that are under 17! Actually, bigger high five to the over-60 crowd! I had to adjust the data a bit to account for an outlier. More on that in the bottom section.
Demographics
What mobile device ecosystem do you use for personal use?
What is your gender identity?
Are you a cat person or a dog person or neither?
Note: there was a fourth question about computer OS: Linux/Windows/Mac. The results were weird, though (about 1/3 Linux, 2/3 blank), so I threw that one out. Unless the real conclusion here is that only a Linux user will tell you repeatedly what their OS is.
This section was right at the end and provided some demographic data about the survey filler-outers. Unfortunately, many people left this section incomplete in a lot of cases. Here's the count of blanks submitted for each question:
phone type         1823
gender identity    1601
pet type             33
As you can see, the most accurate data will be for the "Cat/Dog/Neither" question -- as it should be. Since there were only about 1900 submissions, you can see that we got barely any "phone type" submissions and only about 300 "gender identity" submissions.

I'm a bit bummed that there are less Cat people than Dog people. I'm very bummed at the small fraction of women and other responders. I can only hope that the 1600 responders that left that spot blank have better representation.
But, you ask, what are those teeny tiny slivers on the "phone" and "gender" graphs? That's what the next section is for.
Funny DEVS (or, "The Reason for Data Cleanup")
A fair number of you DEVs think you're pretty funny. In all fairness, you're right! Here are some of my favorite outliers.
Like I mentioned, I had to do some filtering in the "Age" section. Because one of you in the 65+ age category seems to have 500 years of dev experience. Ha. Ha.
id     age      years in software
82     65+      500.0
My other favorite thing were when people put "Other" on the "Demographics" questions. Here's for "What phone do you have?"
- Windows
- Sailfish OS
- Not a smartphone
- Both IOS and Android
- Flip Phone
- None
- None...literally none.
- windows but i wish i didn't
- SYMBION
- WP
- Whatever is in Nokia 230
- Windows mobile
- blackberry
- [redacted for being not a phone -- or possibly a typo of #9]
My very favorite thing about this are the people that, despite our best efforts, decided to type in some form of "Windows" instead.
For gender identity, there were a good number of "Other" submissions that were non-binary, which was neat. And then there were these goobers:
- why does this matter?
- Apache Attack Helicopter
- Batman
And that, ladies, gentlemen, and Apache Attack Helicopter, is the State of the Web.


Top comments (5)
Thanks Ryan!
We should find out if all Linux users are also vegans :P
The batman person reminded me of this:
ps. yah for dogs!
Some of my notes so far:
Hmmm. Counter-theory: Cat people are less likely to take surveys. Maybe? Maybe I'm in denial. I'll ask my cat.
Enjoyed reading this article.
Thanks, I’m glad!